
UNITED STATES
SECURITIES AND EXCHANGE COMMISSION
Washington, D.C. 20549
FORM 40-F
|
o
|
REGISTRATION STATEMENT PURSUANT TO SECTION 12 OF THE SECURITIES EXCHANGE ACT OF 1934
|
OR
|
x
|
ANNUAL REPORT PURSUANT TO SECTION 13(a) OR 15(d) OF THE SECURITIES EXCHANGE ACT OF 1934
|
|
For the fiscal year ended December 31, 2010
|
Commission File Number: 1-31349
|
THOMSON REUTERS CORPORATION
(Exact name of Registrant as specified in its charter)
N/A
(Translation of Registrant's name into English (if applicable))
Province of Ontario, Canada
(Province or other jurisdiction of incorporation or organization)
2741
(Primary Standard Industrial Classification Code Number (if applicable))
98-0176673
(I.R.S. Employer Identification Number (if applicable)
3 Times Square, New York, New York 10036
Telephone: (646) 223-4000
(Address and telephone number of Registrant's principal executive offices)
Thomson Reuters Holdings Inc.
Attn: Deirdre Stanley, Executive Vice President and General Counsel
3 Times Square
New York, New York 10036
Telephone: (646) 223-4000
(Name, address (including zip code) and telephone number (including area code) of agent for service in the United States)
Securities registered or to be registered pursuant to Section 12(b) of the Act:
|
Title of Each Class
|
Name of Each Exchange on Which Registered
|
|
|
Common shares
|
New York Stock Exchange
|
Securities registered or to be registered pursuant to Section 12(g) of the Act:
None
Securities for which there is a reporting obligation pursuant to Section 15(d) of the Act:
Debt Securities
For annual reports, indicate by check mark the information filed with this Form:
|
x Annual information form
|
ý Audited annual financial statements
|
Indicate the number of outstanding shares of each of the issuer's classes of capital or common stock as of the close of the period covered by the annual report:
833,396,235 common shares, 6,000,000 Series II preference shares and 1 Thomson Reuters Founders Share
Indicate by check mark whether the Registrant by filing the information contained in this Form is also thereby furnishing the information to the Commission pursuant to Rule 12g3-2(b) under the Securities Exchange Act of 1934 (the "Exchange Act"). If "Yes" is marked, indicate the file number assigned to the Registrant in connection with such Rule.
| Yes o 82-_________ |
No x
|
Indicate by check mark whether the Registrant (1) has filed all reports required to be filed by Section 13 or 15(d) of the Exchange Act during the preceding 12 months (or for such shorter period that the Registrant was required to file such reports) and (2) has been subject to such filing requirements for the past 90 days.
|
Yes x
|
No o
|
Indicate by check mark whether the registrant has submitted electronically and posted on its corporate Web site, if any, every Interactive Data File required to be submitted and posted pursuant to Rule 405 of Regulation S-T (§232.405 of this chapter) during the preceding 12 months (or for such shorter period that the Registrant was required to submit and post such files).
|
Yes o
|
No o
|
UNDERTAKING AND CONSENT TO SERVICE OF PROCESS
a. Undertaking.
The Registrant undertakes to make available, in person or by telephone, representatives to respond to inquiries made by the Commission staff, and to furnish promptly, when requested to do so by the Commission staff, information relating to: the securities registered pursuant to Form 40-F; the securities in relation to which the obligation to file an annual report on Form 40-F arises; or transactions in said securities.
b. Consent to Service of Process.
|
|
(1)
|
The Registrant has previously filed a Form F-X in connection with the class of securities in relation to which the obligation to file this report arises.
|
|
|
(2)
|
Any change to the name or address of the Registrant’s agent for service shall be communicated promptly to the Commission by amendment to Form F-X referencing the file number of the Registrant.
|
SIGNATURES
Pursuant to the requirements of the Exchange Act, the Registrant certifies that it meets all of the requirements for filing on Form 40-F and has duly caused this annual report to be signed on its behalf by the undersigned, thereto duly authorized.
|
THOMSON REUTERS CORPORATION
|
||
|
By:
|
/s/ Deirdre Stanley
|
|
|
Name:
|
Deirdre Stanley
|
|
|
Title:
|
Executive Vice President and General Counsel
|
|
|
Date: March 9, 2011
|
EXHIBIT INDEX
|
Exhibit Number
|
|
Description
|
|
|
Annual Report for the year ended December 31, 2010 (which constitutes an Annual Information Form and includes Management’s Discussion and Analysis and Audited Financial Statements for the year ended December 31, 2010), and includes a Form 40-F Cross Reference Table on page 148
|
|
|
|
Consent of PricewaterhouseCoopers LLP
|
|
|
|
Certification of the Chief Executive Officer pursuant to Section 302 of the Sarbanes-Oxley Act of 2002
|
|
|
|
Certification of the Chief Financial Officer pursuant to Section 302 of the Sarbanes-Oxley Act of 2002
|
|
|
|
Certification of the Chief Executive Officer pursuant to Section 906 of the Sarbanes-Oxley Act of 2002
|
|
|
|
Certification of the Chief Financial Officer pursuant to Section 906 of the Sarbanes-Oxley Act of 2002
|
|
|
|
Audit Committee Charter
|
Exhibit 99.1

ANNUAL REPORT 2010
MARCH 9, 2011
|
|
|
Information in this annual report is provided as of March 1, 2011, unless otherwise indicated.
Certain statements in this annual report are forward-looking. These forward-looking statements are based on certain assumptions and reflect our current expectations. As a result, forward-looking statements are subject to a number of risks and uncertainties that could cause actual results or events to differ materially from current expectations. Some of the factors that could cause actual results to differ materially from current expectations are discussed in the “Risk Factors” section of this annual report as well as in materials that we from time to time file with, or furnish to, the Canadian securities regulatory authorities and the U.S. Securities and Exchange Commission. There is no assurance that any forward-looking statements will materialize. You are cautioned not to place undue reliance on forward-looking statements, which reflect expectations only as of the date of this annual report. Except as may be required by applicable law, we disclaim any intention or obligation to update or revise any forward-looking statements.
The following terms in this annual report have the following meanings, unless otherwise indicated:
|
|
—
|
“Thomson Reuters,” “we,” “us” and “our” each refers to Thomson Reuters Corporation and its consolidated subsidiaries, unless the context otherwise requires;
|
|
|
—
|
“Woodbridge” refers to The Woodbridge Company Limited and other companies affiliated with it; and
|
|
|
—
|
“$,” “US$” or “dollars” are to U.S. dollars.
|
For information regarding our disclosure requirements under applicable Canadian and U.S. laws and regulations, please see the “Cross Reference Tables” section of this annual report.
Information contained on our website or any other websites identified in this annual report is not part of this annual report. All website addresses listed in this annual report are intended to be inactive, textual references only. The Thomson Reuters logo and our other trademarks, trade names and service names mentioned in this annual report are the property of Thomson Reuters.
TABLE OF CONTENTS
|
2
|
Business
|
|
18
|
Risk Factors
|
|
23
|
Management’s Discussion and Analysis
|
|
74
|
Consolidated Financial Statements
|
|
133
|
Executive Officers and Directors
|
|
139
|
Additional Information
|
|
147
|
Cross Reference Tables
|
Thomson Reuters Annual Report 2010
1
BUSINESS
OVERVIEW
We are the leading source of intelligent information for the world’s businesses and professionals, providing customers with competitive advantage. Intelligent information is a unique synthesis of human intelligence, industry expertise and innovative technology that provides decision-makers with the knowledge to act, enabling them to make better decisions faster. Through over 55,000 employees across more than 100 countries, we deliver this must-have insight to the financial, legal, tax and accounting, healthcare, science and media markets, powered by the world’s most trusted news organization.
We are organized in two divisions:
|
|
●
|
Professional, which consists of our legal, tax and accounting, healthcare and science businesses; and
|
|
|
●
|
Markets, which consists of our financial and media businesses.
|
BUSINESS MODEL AND KEY OPERATING CHARACTERISTICS
We serve a wide variety of customers with a single, tested business model. We derive the majority of our revenues from selling electronic content and services to professionals, primarily on a subscription basis. The table below describes some of our key operating characteristics.
|
Industry leader
|
●
|
#1 or #2 in most of the market segments that we serve
|
|
|
Balanced and diversified
|
●
|
Five distinct core customer groups
|
|
|
●
|
Geographical diversity – our revenues in 2010 were 59% from the Americas, 30% from Europe, the Middle East and Africa (EMEA) and 11% from Asia
|
||
|
●
|
Our largest single customer accounts for approximately 1% of revenues
|
||
|
Attractive business model
|
●
|
86% of our 2010 revenues were recurring
|
|
|
●
|
Strong and consistent cash flow generating abilities
|
||
|
Strong technology platforms and valuable content
|
●
|
Proprietary databases and deeply embedded workflow tools and solutions
|
|
|
●
|
91% of our 2010 revenues were from information delivered electronically, software and services
|
||
|
Reuters acquisition and legacy savings program benefits
|
●
|
Substantial cost savings from acquisition and operational improvements, which have exceeded initial targets
|
|
|
Disciplined financial policies
|
●
|
Invest to drive long-term growth and returns
|
|
|
●
|
Focus on free cash flow
|
||
|
●
|
Support business objectives with a robust capital strategy
|
Thomson Reuters Annual Report 2010
2
2010 ACCOMPLISHMENTS
In 2010, our two key strategic objectives were growth and efficiency. While we are proud of what we accomplished in 2010, we are aware that more remains to be done and we are focused on accelerating the pace of change. Last year, we further integrated our operations, strengthened essential infrastructure and launched major new product platforms. The following table provides information about our progress against last year’s priorities.
|
2010 Priorities
|
2010 Progress | ||
|
Growth
|
We returned to revenue growth in the second half of the year. In 2010, we continued investing in growth initiatives and we launched a number of major new product platforms, including: | ||
| ● |
WestlawNext, our next generation legal research platform;
|
||
| ● |
Thomson Reuters Eikon, our new flagship financial information platform which incorporates the innovative Reuters Insider multimedia news service;
|
||
| ● |
ONESOURCE, our global tax workstation;
|
||
| ● |
Advantage Suite 5.0, our redesigned, state-of-the-art tools to support healthcare decision making; and
|
||
| ● |
Thomson Reuters Elektron, an ultra-low latency infrastructure for electronic trading and data distribution.
|
||
| We acquired a number of key foundational assets to support new initiatives. We invested approximately $0.9 billion in the acquisition of companies that included Complinet to support our new Governance, Risk and Compliance (GRC) business; Point Carbon for our Commodities & Energy business; Serengeti, Pangea3, Canada Law Book and Revista dos Tribunais in Legal for Global General Counsel; GeneGo for Life Sciences; and Aegisoft in Sales & Trading. | |||
| We continued to target rapidly developing economies (RDEs) that we believe will be major contributors to future global growth. | |||
|
Efficiency
|
We made significant progress on a number of efficiency and capability-enhancing initiatives, including: | ||
| ● | Consolidating and integrating technology platforms to achieve cost savings and increase flexibility and scalability; | ||
| ● | Transforming the technology infrastructure of our data centers through standardization, virtualization and automation; and | ||
| ● | Rolling out new customer administration platforms, including a consolidated order-to-cash system which will streamline our interaction with customers and provide us with better usage data. | ||
| Our Reuters integration plus legacy savings initiatives achieved approximately $1.4 billion of annualized run-rate savings as of the end of 2010. | |||
In 2010, we returned to revenue growth. We were able to raise our growth targets during the year as the markets began to improve, and we ended the year with good momentum.
|
|
●
|
Our 2010 revenues from ongoing businesses before currency were $13.1 billion;
|
|
|
●
|
Revenue growth before currency was 1%;
|
|
|
●
|
Our underlying operating profit margin was 19.6% (20.0% before currency and acquisitions); and
|
|
|
●
|
Our underlying free cash flow, which enables us to keep investing in the business and pay dividends, was $2.0 billion.
|
Our new investments in product launches and acquisitions contributed to a 7% decline in underlying operating profit. However, our period of heavy investment is now nearly completed.
Thomson Reuters Annual Report 2010
3
2011 PRIORITIES
In 2011, our top priorities remain focused on growth and efficiency. Our key business activities in 2011 to accelerate growth and capture efficiencies are to:
|
|
—
|
Maximize the growth of our core businesses, such as the U.S. Legal subscription business, Sales & Trading and Investment & Advisory;
|
|
|
—
|
Accelerate our investments in faster growing international markets, with a particular emphasis on rapidly developing economies;
|
|
|
—
|
Reallocate investment to faster growing segments of our business, such as Governance, Risk & Compliance and Commodities & Energy; and
|
|
|
●
|
Streamline product lines, consolidate platforms, reduce technology costs and accelerate the sharing of information across the corporation.
|
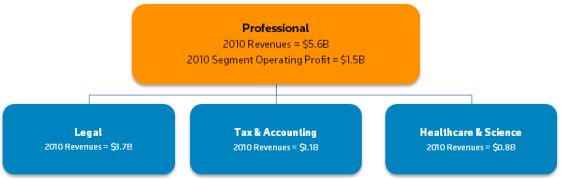
PROFESSIONAL DIVISION
The Professional division consists of our businesses in the Legal, Tax & Accounting and Healthcare & Science sectors. In 2010, the Professional division launched a number of new products, focused on global expansion outside of the United States and achieved net savings through efficiency initiatives.
LEGAL
Legal is a leading provider of critical information, decision support tools, software and services to legal, intellectual property (IP), compliance, business and government professionals around the world. Legal offers a broad range of products and services that utilize our electronic databases of legal, regulatory, news and business information. These products and services include legal research solutions, software-based workflow solutions, compliance solutions, marketing, finance and operations technology and consulting services and legal process outsourcing services.
Westlaw is Legal’s primary online delivery platform. Westlaw offers authoritative content, powerful search and collaboration features and navigation tools that enable customers to find and share specific points of law, build tables of authorities and search for topically-related commentary. In 2010, Legal launched WestlawNext in the United States. WestlawNext delivers improved search, research organization and new collaboration capabilities. We believe these capabilities help researchers get answers faster and provide higher quality, more cost efficient advice.
Thomson Reuters Annual Report 2010
4

In 2010, we launched country-specific versions of Westlaw in India and Hong Kong. We also provide versions of Westlaw for legal professionals in Canada, Chile, China, Ireland, Japan, Spain, the United Kingdom and other countries. Legal also has country-specific online legal research services, some of which are sold under brand names other than Westlaw, including services in Argentina, Australia, Brazil, Denmark, France, New Zealand, Sweden and the United Kingdom. In 2010, Legal acquired Revista dos Tribunais, a leading provider of legal research services in Brazil, and plans to launch a new online service this year.
Through Westlaw International, we offer our online products and services to customers in markets where we may not have an existing publishing presence or have not yet developed a fully customized Westlaw service. As of December 31, 2010, Westlaw International was used by practitioners in 65 countries.
Westlaw Litigator is a complete workflow solution that assists lawyers with all phases of litigation by combining relevant legal research materials with practical tools and services for case evaluation, pre-trial investigation, e-discovery, expert witness selection, settlement negotiation and trial preparation and presentation.
Legal also has a leading collection of assets that support IP lawyers and business professionals across the IP lifecycle, from ideation and maintenance to protection and commercialization.
Legal also is a leading provider of educational information, textbooks and solutions to law students, librarians and professors in the United States. West LegalEdcenter offers one of the largest online collections of continuing legal education (CLE) programs.
In 2010, Legal formed a new Governance, Risk and Compliance (GRC) business unit following the acquisition of Complinet, a leading provider of global compliance information solutions for financial services institutions. The new GRC business unit also includes a number of other Thomson Reuters assets. GRC connects business transactions, strategy and operations to the ever-changing regulatory environment for firms in highly regulated markets.
In 2010, Legal’s acquisitions also included Serengeti, a provider of electronic billing and matter management software, and Pangea3, a leading provider of legal process outsourcing services. Both of these acquisitions expand Legal’s position in the general counsel market, and also complement our existing legal offerings.
The following table provides information about Legal’s major brands.
|
Major Brands
|
Type of Product/Service
|
Target Customers
|
||
|
West
WestlawNext
Westlaw
Westlaw Business
Complinet
|
Legal, regulatory and compliance information-based products and services
|
Lawyers, law students, law librarians and other legal professionals
|
||
|
Foundation Press
West Law School Publishing
West LegalEdcenter
|
Textbooks, study aids, continuing education materials and seminars
|
Law students, lawyers and legal professionals
|
||
|
Sweet & Maxwell
Aranzadi
Brookers
La Ley
Lawtel
Revista dos Tribunais
Canada Law Book
|
Legal information-based products and services
|
Lawyers, law students, law librarians, corporate legal professionals, government agencies and trademark professionals
|
Thomson Reuters Annual Report 2010
5
|
Major Brands
|
Type of Product/Service
|
Target Customers
|
||
|
Carswell
|
Legal, regulatory and compliance information-based products and services
|
Lawyers, law students, law librarians and other legal professionals
|
||
|
Thomson CompuMark
SAEGIS
|
Trademark research and protection
|
Trademark attorneys and agents
|
||
|
Derwent World Patents Index
Thomson Innovation
|
Patent research and analysis
|
Legal, intellectual property, research & development and business professionals
|
||
|
Thomson IP Management Services
|
Intellectual asset management
|
Legal and intellectual property professionals
|
||
|
Elite
Elite 3E
ProLaw
|
Suite of software applications that assist with front- and back-office management functions, including document management, case management, general ledger accounting, timekeeping, billing and records management
|
Lawyers, law firm finance and operations
|
||
|
FindLaw
Hubbard One
|
Online legal directory, website creation and hosting services and law firm marketing solutions
|
Lawyers and legal professionals
|
||
|
Hildebrandt Baker Robbins
|
Strategic, technology, operations and information consulting advisory services
|
Lawyers and law firm finance, operations and business development professionals
|
||
|
Westlaw Litigator
West Case Notebook
West LiveNote
Westlaw CaseLogistix
Westlaw Round Table Group
|
Online research tools, case analysis software, deposition technology, as well as expert witness and document review services to support each stage of the litigation workflow
|
Lawyers, paralegals, courts and court reporters
|
||
|
Serengeti
|
Electronic billing and matter management software
|
Corporate counsel and law firm professionals
|
||
|
Pangea3
|
Legal process outsourcing services
|
Corporate and law firm legal professionals
|
||
|
CLEAR
PeopleMap
|
Public records products and services
|
Government, law enforcement, legal and corporate investigative professionals
|
COMPETITION
Legal’s primary global competitors are Reed Elsevier (which operates LexisNexis) and Wolters Kluwer. Legal also competes with other companies that provide legal and regulatory information, as well as practice and matter management software, client development and other services to support legal professionals.
TAX & ACCOUNTING
Tax & Accounting is a leading global provider of technology and information solutions, as well as integrated tax compliance and accounting software and services, to accounting, tax and corporate finance professionals in accounting firms, corporations, law firms and government. Tax & Accounting has two global businesses – Workflow & Service Solutions and Business Compliance & Knowledge Solutions.
Workflow & Service Solutions provides tax compliance, accounting and practice management software solutions to corporate tax departments and accounting firms around the world.
Business Compliance & Knowledge Solutions provides tax and accounting research and guidance information, online media and CPA certification services to corporations, accounting firms and law firms around the world.
In 2010, Tax & Accounting began to execute its strategy to expand globally, which included launching the ONESOURCE global tax workstation. Tax & Accounting’s global expansion strategy also extends to content research and certification, including plans to offer its flagship product Checkpoint in more countries around the world, and plans to grow several online products and authoritative information for tax and accounting professionals outside the U.S., with brands such as Carswell in Canada, Brookers in New Zealand and La Ley in Argentina.
Thomson Reuters Annual Report 2010
6
The following table provides information about Tax & Accounting’s major brands.
|
Major Brands
|
Type of Product/Service
|
Target Customers
|
||
|
Workflow & Service Solutions
|
||||
|
ONESOURCE
ONESOURCE Workflow Manager
ONESOURCE Income Tax
ONESOURCE Tax Provision
ONESOURCE Transfer Pricing
ONESOURCE Sales & Use Tax
ONESOURCE Property Tax
ONESOURCE Trust Tax
ONESOURCE 1099
|
Global tax workstation that integrates existing global tax compliance software with local tax compliance tools in a growing number of countries and can manage a company’s entire tax workflow – linking global staff, controllers, finance, and even tax advisors and auditors on one system, and provides the solutions needed to handle tax planning, transfer pricing compliance, tax return compliance and global tax reporting needs. The products or services can be sold separately or as a suite
|
Corporate, legal, bank and trust market and large accounting firms
|
||
|
Abacus
|
Suite of products and related business operations that offer corporate income tax software products to customers in Hong Kong, Ireland, The Netherlands, New Zealand and the U.K. and supply VAT compliance software for 19 countries across Europe and Asia-Pacific
|
Corporate tax departments and large accounting firms
|
||
|
PowerTax
|
Software solution that brings together a range of products to help tax professionals in Australia and New Zealand manage corporate tax, trust and property compliance and management reporting
|
Corporate tax departments and large accounting firms
|
||
|
Sabrix
|
Software and related services covering tax requirements for more than 170 countries, which are used to determine, calculate and record sales tax, VAT, excise tax and industry specific taxes
|
Corporate tax departments and large accounting firms
|
||
|
CS Professional Suite
|
Integrated series of software applications that encompass every aspect of a firm's operations, from collecting client data and posting finished tax returns to the ongoing management of engagements and an accountant’s entire practice
|
Small to medium accounting firms
|
||
|
Enterprise Suite
|
Integrated set of solutions covering tax preparation, engagement, practice management and document and workflow management that include GoSystem Tax and GoFileRoom
|
Large accounting firms
|
||
|
Digita
|
Integrated U.K. tax compliance and accounting software and services
|
Accounting firms and corporate tax departments
|
||
|
Business Compliance & Knowledge Solutions
|
||||
|
Checkpoint
|
Integrated platform that includes information-based solutions, expert guidance and workflow tools from various Tax & Accounting products, such as RIA, WG&L and PPC
|
Accounting firms, corporate tax, finance and accounting departments, law firms and governments
|
||
Thomson Reuters Annual Report 2010
7
|
Major Brands
|
Type of Product/Service
|
Target Customers
|
||
|
Checkpoint Learning
|
Integrated online offering that combines global research, training and certification with course and credit-tracking capability for individuals and large groups, and includes continuing professional education and training solutions from various products such as PPC, PASS Online, GearUp, MicroMash, Reqwired, and AuditWatch
|
Accounting firms and corporate finance, accounting and tax departments
|
||
|
RIA
Paisley
PPC
WG&L
Quickfinder
Brookers Online
Carswell
La Ley
|
Expert guidance and research from around the globe available on the Checkpoint platform or in print
|
Accounting firms, corporate tax, finance and accounting departments, law firms and governments
|
COMPETITION
Tax & Accounting’s primary competitor across all customer segments is Wolters Kluwer (which includes CCH). Other major competitors include Intuit in the professional software and services market, CORPTAX (owned by MLM Information Services) and Vertex in the corporate software and services market. Tax & Accounting also competes with other providers of software and services.
HEALTHCARE & SCIENCE
Our Healthcare & Science business is a leading provider of information, tools, analytics and decision support solutions that help organizations speed scientific discovery and improve healthcare efficiency and quality.
Our healthcare solutions enable hospitals, clinicians, employers, health plans and governments to more effectively manage the cost and quality of their healthcare spending and delivery, improve their market positioning and drive enterprise growth.
Our science solutions provide science professionals in academia, governments and industry with content, technologies and expertise that assist them in all stages of the research and discovery (R&D) cycle, from scientific discovery to product release.
In 2010, Healthcare & Science launched a new version of Advantage Suite.
The following table provides information about Healthcare & Science’s major brands.
|
Major Brands
|
Type of Product/Service
|
Target Customers
|
||
|
Thomson Reuters Advantage Suite, MarketScan Research Databases and DataProbe
|
Decision support systems, fraud, waste and abuse detection, market intelligence, benchmarking and research for managing the purchase, administration and delivery of healthcare services and benefits
|
Employers, governmental healthcare purchasers, managed care and insurance companies, pharmaceutical companies and health services research providers
|
||
|
Thomson Reuters Micromedex
|
Comprehensive database and solution set of drugs, disease information, medical emergency and poison control procedures, patient education and other relevant clinical, toxicological and environmental health and safety information
|
Physicians, pharmacists, health professionals, pharmaceutical companies, hospitals, poison control centers, corporations, government agencies and insurance companies
|
||
|
CareDiscovery and
ActionOI
|
Performance improvement solutions integrated with analytics and expert services designed to help reduce risk, focus resources and evaluate and manage performance
|
Hospitals and health systems, administrative staff, service line planners, patient safety and quality managers, business development, marketing, and financial and operations managers
|
Thomson Reuters Annual Report 2010
8
|
Major Brands
|
Type of Product/Service
|
Target Customers
|
||
|
Thomson Reuters Web of Knowledge
|
Comprehensive and integrated platform that includes proprietary Thomson Reuters databases as well as third party-hosted content, editorially selected websites and tools to access, analyze and manage research information
|
Research scientists and scholars, government agencies, research libraries and universities and colleges
|
||
|
Web of Science
|
Comprehensive database providing a source for journal article-cited references and access to abstracted and indexed journals and conference proceedings; available via the Web of Knowledge platform
|
Research scientists and scholars, government agencies, research libraries and universities and colleges
|
||
|
Thomson Reuters Pharma
|
Integrated online platform that delivers pharmaceutical and drug development information, patents, company news, professional meeting reports and other relevant content
|
Pharmaceutical and biotechnology companies
|
||
|
Thomson Reuters Integrity
|
Integrated online platform delivering drug discovery and biomarker content and analytic functionality
|
Pharmaceutical and biotechnology companies, academic centers and research institutes
|
COMPETITION
The principal competitors of Healthcare & Science in the clinical and drug information market are Reed Elsevier and Wolters Kluwer. Within the Healthcare provider market, Premier and The Advisory Board are principal competitors. Within the Payer market, our principal competitor is Ingenix (a division of UnitedHealth Group). Principal competitors in the Life Sciences market are Reed Elsevier, Wolters Kluwer, Informa and Chemical Abstracts Services (CAS). Within the Science and Scholarly Research market, Reed Elsevier and Google Scholar are principal competitors.
Thomson Reuters Annual Report 2010
9
MARKETS DIVISION
The Markets division serves financial services and corporate professionals globally, with Reuters Media serving a broader professional and consumer media market. The Markets division delivers critical information, supporting technology and infrastructure to a diverse set of customers. These solutions are designed to help our customers generate superior returns, improve risk management, increase access to liquidity and create efficient, reliable infrastructures in increasingly global, electronic and multi-asset class markets. Markets customers can access information and analytics through our web-based desktop solutions, datafeeds and mobile applications for a wide range of devices.
The Markets division consists of our Sales & Trading, Investment & Advisory, Enterprise and Media businesses.

SALES & TRADING
Sales & Trading provides a combination of information, community, trading and post-trade connectivity requirements for the trading floor activities of buy-side and sell-side clients in foreign exchange (FX), fixed income and derivatives, equities and other exchange-traded instruments, as well as in the commodities and energy markets.
In 2010, Sales & Trading launched Thomson Reuters Eikon, a new premium desktop product. Thomson Reuters Eikon combines the latest in multimedia and content in a new, easy to use interface. We plan to utilize Thomson Reuters Eikon as the platform for all of our financial desktop products, ultimately replacing Reuters 3000 Xtra, Reuters Trader and other solutions. Thomson Reuters Eikon users are financial markets professionals who require a powerful combination of deep, global, cross-asset news and content combined with sophisticated pre-trade decision-making, communication and trade connectivity tools. Thomson Reuters Eikon also includes Reuters Insider, our new on-demand video service for financial news, content and information. Customers can personalize Reuters Insider to watch and focus directly on what is important to them.

In 2010, Sales & Trading also strengthened its commodities & energy business by acquiring Point Carbon, a provider of trading analytics, news and content for energy and environmental markets. Traders and portfolio managers utilize Point Carbon’s products and services for information on the fluctuating supply, demand and price of gas, electricity and carbon and to develop market strategies. Point Carbon’s information also covers power output and pipeline capacity, global weather forecasts for heat, wind and rain or political events and crises.
Thomson Reuters Annual Report 2010
10
Sales & Trading’s suite of products also allow customers to trade with each other and connect their systems to electronic markets.
The following table provides information about Sales & Trading’s major brands.
|
Major Brands
|
Type of Product/Service
|
Target Customers
|
||
|
Thomson Reuters Eikon, Reuters 3000 Xtra
|
Premium desktop products providing pre-trade decision-making tools, news, real-time pricing, trading connectivity and collaboration tools
|
Trading professionals, salespeople, brokers and financial analysts
|
||
|
Thomson Reuters Dealing
|
Peer-to-peer conversational trading product primarily related to FX and money markets
|
FX and money market traders, sales desks, hedge funds and voice brokers
|
||
|
Thomson Reuters Matching
|
Electronic FX trade matching system
|
FX traders, sales desks and hedge funds
|
||
|
Tradeweb
|
Global electronic multi-dealer-to-customer marketplace for trading fixed income, derivatives and money market products which connects major investment banks with institutional clients
|
Institutional traders
|
COMPETITION
Sales & Trading information products compete with Bloomberg, SunGard, Telekurs and IDC as well as local, regional and niche competitors ranging from Markit and SuperDerivatives to Quick, Xinhua Finance and Yahoo! Finance. In the electronic trading business, Sales & Trading competes with Fidessa and the large inter-dealer brokers, such as ICAP’s EBS platform. In addition, Sales & Trading competes with single-bank and multi-bank portals such as FXall and MarketAxess.
INVESTMENT & ADVISORY
Investment & Advisory provides information, analytics and workflow solutions that enable effective decision-making and drive performance by its customers in investment management, investment banking, wealth management and corporate services.
Investment & Advisory customers have direct, real-time access to the global, foundational content sets needed for intelligent decision-making, such as fundamentals, estimates, economic indicators, ownership data, broker research, deals data, equity and fixed income data, filings, exchange data, tick history and time series data. Our proprietary sources of content include I/B/E/S, First Call, Worldscope, Datastream, Lipper, StarMine, StreetEvents and Reuters News.
The Investment Management business provides institutional asset management firms and private banking clients with solutions that enable them to manage and execute every phase of the investment decision process. Our integrated solution suite is designed to enable customers to efficiently monitor the markets and perform fundamental and quantitative analysis, portfolio risk and performance analysis and economic forecasting. We also provide a host of reporting solutions that enable our customers to publish their research and market their funds. In addition, our solutions are linked on the back-end, enabling enterprise efficiency and collaboration and communication across the entire research team.
The Investment Banking business provides workflow solutions for investment bankers, advisors, private equity and venture capital professionals, as well as sell-side brokers. We also provide research support to the academic community. Our solutions support the deal-making community by providing the information and research that enables our customers to undertake the detailed analyses and valuations fundamental to their businesses. Investment bankers rely on our news services (such as BreakingViews and publications such as IFR, Buyouts and VCJ) to deliver market insight and new ideas.
Our Wealth Management business provides workflow solutions to the wealth management community, including managers of high net worth investors and private banking professionals. Our front-to-back office solution gives advisors the tools to streamline back office processes and workflows. Our scalable solution sets offer proposal generation, portfolio management, asset allocation, rebalancing, financial planning, alerting, investment selection tools and performance reporting to wealth management professionals.
Thomson Reuters Annual Report 2010
11
Our Corporate Services business provides targeted solutions across key corporate functions, such as investor relations, public relations, corporate communications, corporate development, finance and treasury. With our solutions, companies can access market-moving information and coordinate decision-making. Customers can also gain competitive insight with our institutional-quality information, analytics and tools, and they can benefit from operational and cost efficiencies by consolidating the number of their outside providers. In 2010, the Corporate Services business launched a series of innovative solutions to complement our existing offerings, including Smart Targets and Web Disclosure for Investor Relations (IR) professionals, Thomson ONE Public Relations for Public Relations (PR) professionals, and advanced visual analytics for corporate development and strategy professionals.
The following table provides information about Investment & Advisory’s major brands.
|
Major Brands and Product Categories
|
Type of Product/Service
|
Target Customers
|
||
|
Thomson ONE platform
|
Integrated access to information, analytics and tools delivered within workspaces designed specifically for each target customer’s workflow
|
Portfolio managers, buy-side research analysts and associates, investment bankers, consultants, lawyers, private equity professionals, wealth management and high net worth professionals
Corporate clients including investor relations officers, public relations officers, strategy and research professionals, treasurers and finance professionals
|
||
|
Thomson Reuters Datastream
|
Sophisticated historical time-series analysis that enables the visualization of economic and asset class trends and relationships
|
Economists, strategists, portfolio managers and research analysts
|
||
|
QA Studio and QA Direct
|
Comprehensive data management and analytics solutions for sophisticated quantitative research
|
Quantitative portfolio managers and research analysts
|
||
|
Thomson Reuters Deal
Analytics
|
Screening, targeting, financial and comparable analysis and valuations, pitch book building, M&A league tables
|
Investment bankers and private equity professionals
|
||
|
Thomson Reuters Deals Business Intelligence
|
Analysis and reporting tools for business planning, including performance, market share and targeting
|
Business management and strategy teams in investment banks
|
||
|
SDC Platinum
|
Database for analyzing investment banking and deal trends
|
Investment bankers, consultants, lawyers and private equity professionals
|
||
|
Thomson Reuters Knowledge Direct for Wealth Management
|
Premium content including exchange data, news, company fundamentals, broker research and consensus reports
|
Wealth management professionals and individual investors
|
||
|
BETA Systems
|
Brokerage processing system
|
Retail and institutional wealth management professionals
|
||
|
Lipper
|
Mutual fund information, benchmarking data, performance information and analysis
|
Asset management professionals including fund marketing, sales, product development, performance measurement, financial intermediaries and individual investors
|
||
|
Multimedia Solutions
|
Webcasting solutions and web publishing tools with unique distribution networks and analytics
|
Corporate communications, employee communications, marketing, IR and PR professionals
|
COMPETITION
Investment & Advisory competes with Bloomberg, FactSet, S&P/Capital IQ, Morningstar, SunGard Data Systems, Broadridge Financial Solutions and other companies.
Thomson Reuters Annual Report 2010
12
ENTERPRISE
Enterprise delivers technology and content for the financial markets, which enable firms to efficiently obtain real and non-real time content to make business and trading decisions and meet regulatory requirements.
In 2010, Enterprise launched Thomson Reuters Elektron, a high-speed, resilient financial markets network and hosting environment. Thomson Reuters Elektron allows financial firms of all sizes to trade faster, gain access to electronic pricing data from over 350 exchanges and trading platforms, and interact with each other across a global and resilient infrastructure.
A key component of Thomson Reuters Elektron is our Enterprise Platform, which enables the open exchange of financial data, liquidity and business opportunities between participants in the financial community.
The Enterprise Content business delivers pricing and reference data used by middle and back offices for trade matching and settlement, risk management and analysis and portfolio evaluation. This includes independent, accurate and timely pricing information for 2.5 million fixed income, derivatives instruments and loans.
The combination of our Machine Readable News and Tick History products delivers unique capabilities for the development and back-testing of quantitative and event-based trading and investment strategies.
Our Enterprise business is also one of the largest providers of risk management solutions.
Omgeo, our joint venture with The Depository Trust & Clearing Corporation, automates and streamlines post-trade operations, enabling clients to accelerate the clearing and settlement of trades and reduce counterparty and credit risk.
The following table provides information about Enterprise’s major brands.
|
Major Brands
|
Type of Product/Service
|
Target Customers
|
||
|
Thomson Reuters Elektron
|
High-speed resilient financial markets network and hosting environment
|
Investment banks, asset managers, custodians, liquidity centers and depositories, hedge funds, prime brokers, proprietary traders, inter-dealer brokers, multilateral trading facilities (MTFs), central banks and fund administrators
|
||
|
Thomson Reuters Real Time
|
Real-time datafeeds related to programmatic and automated trading, market and credit risk, instrument pricing and portfolio management and valuations
|
Financial institutions
|
||
|
Thomson Reuters Enterprise Platform
|
Software platform for integrating and distributing real-time and historical financial information
|
Financial institutions
|
||
|
Thomson Reuters Datascope
|
Data delivery platform for non-streaming cross asset class content globally
|
Custodians, banks, insurance companies, fund administrators, pension firms, mutual funds, hedge funds, sovereign funds, underwriters, market makers, accounting firms and government institutions
|
COMPETITION
Enterprise’s real-time data feeds and pricing and reference data offerings compete with Bloomberg, S&P, IDC and Telekurs. In addition, Enterprise’s market data delivery offerings compete with specialty technology providers, exchanges such as NYSE Euronext and large IT vendors such as IBM. Competitors in the risk management sector include SunGard, Algorithmics, Murex, Misys and Calypso. In the portfolio accounting market, competitors include Eagle, Simcorp Dimension, PAM, Beauchamp and DST.
MEDIA
Powered by approximately 3,000 journalists reporting from nearly 200 bureaus around the world, Media provides indispensable news and information tailored for media and business professionals and drives decision-making around the globe with speed, accuracy and independence.
Our News Agency business provides the world’s media companies with text, video, pictures, graphics and multimedia products.
Thomson Reuters Annual Report 2010
13
In 2010, Media launched Reuters America for Publishers as part of its planned transformation from a traditional news agency business model to a platform-oriented business model that focuses on providing coverage, content solutions and services that meet our clients’ needs. This new service provides U.S.-based print and online publishers with broader and deeper coverage of U.S. news as well as tools and on-demand services designed to increase efficiency, reduce cost and increase revenues.
Our Consumer Publishing products include the advertising-supported, direct-to-consumer publishing activities of Reuters.com and its global network of websites, mobile services and smartphone applications, online video and electronic out-of-home displays. These products deliver professional-grade news, opinion and analysis to business professionals.
The following table provides information about Media’s major brands.
|
Major Brands and Product Categories
|
Type of Product/Service
|
Target Customers
|
||
|
Reuters America for Publishers
|
Tailored solution providing deeper U.S. domestic coverage, flexible delivery formats and services designed to increase newsroom efficiencies
|
U.S.-based print and online publishers
|
||
|
Text
|
Fast, accurate and extensive coverage of global, regional and national news and events in 20 languages covering general, political, business, financial, entertainment, lifestyle, technology, health, science, sports and human- interest news
|
Newspapers, magazines, television and cable networks, radio stations and websites
|
||
|
Video
|
Live/breaking news and file-based delivery of general, financial, sports, entertainment and lifestyle news videos, as well as access to video archive
|
Television and cable networks, newspapers and websites
|
||
|
Pictures
|
Up-to-the-minute photographs from our global network of over 600 photojournalists and an online picture archive that consists of over four million images covering news, sports, features, entertainment and business
|
Newspapers, magazines, book publishers, websites, creative industry, television and cable networks
|
||
|
Graphics
|
Graphics that enhance information and provide a visual analysis of top world events through news, sports, technical, scientific, business, environmental, economic and financial charts and information graphics
|
Newspapers, magazines, book publishers, websites, creative industry, television and cable networks
|
||
|
Multimedia
|
Prioritized, ready-to-publish online reports, video and picture selections designed for digital platforms
|
Digital platforms including websites and mobile services
|
||
|
Consumer publishing
|
Advertising-supported websites, mobile services and smartphone applications, online video and electronic out-of-home displays
|
Global business professionals
|
COMPETITION
Major global competitors of our News Agency business include the Associated Press, Agence France-Presse, Getty and Bloomberg. Competitors of Media’s consumer products and services include WSJ.com, Bloomberg.com, Forbes.com, CNNMoney and FT.com.
CORPORATE HEADQUARTERS
Our corporate headquarters seeks to foster a group-wide approach to management while allowing the Professional and Markets divisions sufficient operational flexibility to serve their customers effectively. The corporate headquarters’ four primary areas of focus are strategy and capital allocation, technology and innovation, talent management and brand management. The corporate headquarters is also responsible for overall direction on communications, investor relations, tax, accounting, finance, treasury and legal, and administers certain human resources services, such as employee compensation, benefits administration, share plans and training and development.
Thomson Reuters Annual Report 2010
14
Our corporate headquarters are located in New York, New York with key operations in the United Kingdom, India, Eagan, Minnesota and Stamford, Connecticut.
TECHNOLOGY
Over the last few years, we have made significant investments in our technology. Technology-related capital expenditures in 2010 represented approximately 89% of our total capital expenditures for the year. As the number of professionals around the world grows, we believe that there will be an increasing demand for our products and services. We are focused on constantly improving our technology infrastructure to meet this growing demand at an appropriate cost.
In order to provide intelligent information to business and professional customers around the world, we focus on integrating our proprietary content with technology. In particular, we use technology to maximize the value of our information. We continuously are improving our algorithms, search capabilities, user interfaces, workflow, collaboration tools, data and overall product performance in order to increase our customers’ efficiency and effectiveness.
We are continuing to develop our online delivery platforms, taking advantage of the latest technologies. Our platforms allow us to more easily combine content from our various online services, reduce product delivery costs and reduce development time for new products and services. For various global products, we use a common database platform that supports multiple applications. This allows us to deploy products quickly into numerous markets, especially where we provide country or industry-specific information that is combined with data that is used in other Thomson Reuters products.
We are also focused on further improving efficiencies to lower costs and enhance our competitive position. We are reducing the complexity and increasing the efficiency of our underlying data center infrastructure through virtualization, automation and standardization. We are also simplifying network design in our communications infrastructure.
INTELLECTUAL PROPERTY
Many of our products and services are comprised of information delivered through a variety of media, including online, software-based applications, mobile devices, books, journals, compact discs and dedicated transmission lines. Our principal IP assets include patents, trademarks, trade secrets, databases and copyrights in our content. We believe that our IP is sufficient to permit us to carry on our business as presently conducted. We also rely on confidentiality agreements to protect our rights. We continue to apply for and receive patents for our innovative technologies. Additionally, we continue to acquire patents through the acquisition of companies. We also obtain significant content and data through third party licensing arrangements with content providers. We have registered a number of website domain names in connection with our online operations.
RESEARCH AND DEVELOPMENT
Innovation is essential to our success and is one of our primary bases of competition.
We undertake significant research and development (R&D) which is then incorporated into our products, services and technology. Our R&D team includes research scientists and software developers with backgrounds in mathematics, linguistics, psychology, computer science and artificial intelligence.
We have recently filed a number of patents on topics such as system ranking, information storage, data mining, information patterns, forecasting valuation and routing trade orders. We have also published academic papers on topics such as machine learning algorithms and information retrieval.
In addition to a dedicated corporate R&D team, our business units also use innovative technology to develop products and services. Recent examples include court transcripts with synchronized video and text versions, mobile applications that deliver tailored breaking news and business information via user-selected alerting, and a significant addition to our new legal research product, WestlawNext, called foldering, which allows customers to be able to store all of their related research for future use and automatic updating. Our businesses also recently created our new Reuters Insider, Thomson Reuters Eikon and Thomson Reuters Elektron products.
SALES AND MARKETING
We primarily sell our products and services directly to our customers. In addition, we have been successful in selling some of our products and services directly to customers via the Internet. Focusing some of our marketing and sales efforts online has allowed us to broaden our range of customers and reduce sales and marketing costs.
Thomson Reuters Annual Report 2010
15
CORPORATE RESPONSIBILITY
Corporate Responsibility (CR) is an integral part of the way we do business. We have a CR policy that describes how we manage our relationships with stakeholders in four areas: the community (the places and societies in which we operate), our workplace (employees), the environment and the marketplace (customers, suppliers and investors). By articulating focus areas, we are able to define our responses to global standards and charters in ways that are meaningful and relevant to our business. Our current CR priorities are diversity, community impact, responsible sourcing and the environment. To address these priorities, we have continued to develop and implement programs and initiatives, including measurement, reporting and governance. For more information, please see the Corporate Responsibility section of our website, www.thomsonreuters.com.
COMMUNITY
In 2010, our employees exemplified a commitment to the community by volunteering nearly 16,000 hours. Through our Community Champion Awards program, we recognize and reward employee community service efforts.
The Thomson Reuters Foundation, a not-for-profit organization, leverages skills and expertise across our organization to increase trust in, and access to, the rule of law, save lives through the provision of trusted information and improve standards of journalism. In 2010, the Foundation successfully launched and continued to develop three major programs:
|
|
●
|
Emergency Information Service (EIS) provides vital information through text messages to populations affected by disaster. EIS was used in Haiti after the massive earthquake in January 2010.
|
|
|
●
|
TrustLaw is a global hub for pro bono legal services that connects lawyers with non-governmental organizations and others in need of free legal support and also provides news and information on governance.
|
|
|
●
|
AlertNet.org is a global humanitarian news website that now includes new media services. AlertNet also includes free tools and resources to help journalists cover difficult crises and multimedia reporting on underreported emergencies.
|
WORKPLACE
Our business is founded on integrity, independence and freedom from bias which is codified through the Thomson Reuters Trust Principles and complemented by our Code of Business Conduct and Ethics. All of our employees are required to acknowledge our Code of Business Conduct and Ethics, which reflects our values as a company and our approach to doing business. We also provide our employees with a confidential and anonymous helpline for reporting Code-related issues.
ENVIRONMENT
We derived 91% of our 2010 revenues from information delivered electronically, software and services. We believe that our efforts over the last decade to move more of our business from print to electronic saves vital natural resources and chemicals in printing and the shipping process. We also seek to operate our data centers and our global real estate portfolio as efficiently as possible.
In 2010, we launched a project to collect consumption data from across our business to provide a comprehensive assessment of our annual environment impact, or carbon footprint. As part of this project, we have been developing a strategy for measuring our carbon footprint across the business on a global basis.
We promote environmental best practices through our network of 75 staff-driven “Green Teams” around the world, enabling them to share ideas and promote new initiatives, such as our use of telepresence videoconferencing units in our largest locations to help reduce travel.
One additional way we address global environmental challenges is through the information we provide to customers and the public. Through Reuters Media’s dedicated environment-focused blogs and video channels, we provide news on environmental topics and encourage debate and increased awareness.
MARKETPLACE
In 2010, we launched a new supply chain ethical code that is designed to ensure that our suppliers met a specified set of standards. A number of our suppliers have agreed to comply with the code in providing services to us.
ACQUISITIONS AND DISPOSITIONS
In 2008, we completed our acquisition of Reuters for approximately $16 billion. During the last three years, we also made a number of tactical acquisitions which complemented our existing businesses. For many of these acquisitions, we purchased information or a service that we integrated into our operations to broaden the range of our offerings. These acquisitions have expanded our product offerings, enabled us to enter adjacent markets, tap new revenue streams and achieve cost efficiencies. Key tactical acquisitions in 2010 included Complinet, Point Carbon, Serengeti, Canada Law Book, Revista dos Tribunais, GeneGo and Pangea3.
Thomson Reuters Annual Report 2010
16
In addition, as part of our continuing strategy to optimize our portfolio of businesses and ensure that we are investing in parts of our business that offer the greatest opportunities to achieve growth and returns, we also actively pursued the sale of a number of businesses during the last three years. We recently decided to pursue the sale of our BARBRI business and our Scandinavian Legal and Tax & Accounting businesses from our Professional division, and we recently sold Treasura in our Markets division. For more information on acquisitions and dispositions that we made in the last three years, please see the “Management’s Discussion and Analysis” section of this annual report.
EMPLOYEES
The following table sets forth information about our employees as of December 31, 2010.
|
Thomson Reuters
|
57,900 | |||
|
Americas
|
27,900 | |||
|
Europe, Middle East and Africa
|
12,300 | |||
|
Asia
|
17,700 | |||
|
Professional division
|
26,500 | |||
|
Legal
|
15,300 | |||
|
Tax & Accounting
|
5,200 | |||
|
Healthcare & Science
|
4,600 | |||
|
Other
|
1,400 | |||
|
Markets division
|
28,800 | |||
|
Corporate headquarters
|
2,600 |
We believe that we generally have good relations with our employees, unions and work councils, although we have disputes from time to time with the various unions that represent some of our employees. Our senior management team is committed to maintaining good relations with our employees, unions and works councils.
PROPERTIES AND FACILITIES
We own and lease office space and facilities around the world to support our businesses. We believe that our properties are in good condition and are adequate and suitable for our present purposes. The following table provides summary information about our principal properties as of December 31, 2010.
|
Facility
|
Approx. sq. ft.
|
Owned/Leased
|
Principal use
|
|||
|
610 Opperman Drive,
Eagan, Minnesota
|
|
2,792,000
|
Owned
|
Legal headquarters and operating facilities
|
||
|
3 Times Square,
New York, New York
|
435,300
|
Owned/Leased2
|
Thomson Reuters headquarters and Markets division operating facilities
|
|||
|
195 Broadway,
New York, New York
|
|
435,200
|
Leased
|
Markets division and Tax & Accounting offices
|
||
|
2395 Midway Road,
Carrollton, Texas
|
|
409,150
|
Owned
|
Tax & Accounting operating facilities
|
||
|
Boston, Massachusetts1
|
358,300
|
Leased
|
Markets division operating facilities
|
|||
|
Geneva, Switzerland
|
291,160
|
Owned
|
Markets division operating facilities
|
|||
|
Canary Wharf,
London, United Kingdom
|
282,700
|
Leased
|
Markets division operating facilities
|
|||
|
RMZ Infinity, Bangalore, India
|
|
248,000
|
Leased
|
Markets division operating facilities
|
||
|
Blackwall Yard, London,
United Kingdom
|
240,000
|
Owned
|
Markets division Dockland’s Technical Center
|
|
1
|
Consists of three addresses.
|
|
2
|
We lease this facility from 3XSQ Associates, an entity owned by one of our subsidiaries and Rudin Times Square Associates LLC. 3XSQ Associates was formed to build and operate the 3 Times Square property and building in New York, New York that now serves as our corporate headquarters. 435,300 sq. ft. represents the net amount of space that we currently use under our lease. The lease covers a total of 692,200 sq. ft., of which 256,900 sq. ft. has been sub-leased.
|
Thomson Reuters Annual Report 2010
17
RISK FACTORS
The risks and uncertainties below represent the risks that our management believes are material. If any of the events or developments discussed below actually occurs, our business, financial condition or results of operations could be adversely affected. Other factors not presently known to us or that we presently believe are not material could also affect our future business and operations.
We may be adversely affected by future downturns in the markets that we serve.
Our performance depends on the financial health and strength of our customers, which in turn is dependent on the general economies in our major markets in North America, Europe and Asia. The global recession in 2009 caused disruptions and volatility in economies worldwide, particularly in the financial services industry. Although the global economy began to improve and recover in 2010, future downturns in the financial services industry in one or more of the countries in which we operate or significant trading market disruptions or suspensions could adversely affect our business. Any one or more of these events may contribute to reduced activity by our customers, decrease demand for our products and services, and adversely affect suppliers and third parties on whom we depend. The economic recession also impacted the legal industry, causing a number of law firms to increase their focus on reducing costs. In 2010, we derived approximately 85% of our revenues from financial and legal customers. Cost-cutting by any of our customer segments may also adversely affect our financial results.
We operate in highly competitive markets and may be adversely affected by this competition.
The information and news industries are highly competitive. Many of our principal competitors have substantial financial resources, recognized brands, technological expertise and market experience. Our competitors are also enhancing their products and services, developing new products and services and investing in technology to better serve the needs of their existing customers and to attract new customers. Our competitors may acquire additional businesses in key sectors that will allow them to offer a broader array of products and services. We may also face increased competition from Internet service companies and search providers that could pose a threat to some of our businesses by providing more in-depth offerings, adapting their products and services to meet the demands of their customers or combining with one of their traditional competitors to enhance their products and services. Competition may require us to reduce the price of our products and services or make additional capital investments that would adversely affect profit margins. If we are unable or unwilling to do so, we may lose market share and our financial results may be adversely affected. In addition, some of our customers have in the past and may decide again to develop independently certain products and services that they obtain from us, including through the formation of consortia. To the extent that customers become more self-sufficient, demand for our products and services may be reduced, which may adversely affect our financial results.
Increased accessibility to free or relatively inexpensive information sources may reduce demand for our products and services.
In recent years, more public sources of free or relatively inexpensive information have become available, particularly through the Internet, and this trend is expected to continue. For example, some governmental and regulatory agencies have increased the amount of information they make publicly available at no cost. In addition, several companies and organizations have made certain legal and financial information publicly available at no cost. “Open source” software that is available for free may also provide some functionality similar to that in some of our products. Public sources of free or relatively inexpensive information may reduce demand for our products and services. Although we believe our information is more valuable and enhanced through analysis, tools and applications that are embedded into customers’ workflows, our financial results may be adversely affected if our customers choose to use these public sources as a substitute for our products or services.
If we are unable to develop new products, services, applications and functionalities to meet our customers’ needs, attract new customers or expand into new geographic markets, our ability to generate revenues may be adversely affected.
Our growth strategy involves developing new products, services, applications and functionalities to meet our customers’ needs for intelligent information solutions and maintaining a strong position in the sectors that we serve. As the information and news services industries undergo rapid evolution, we must be able to anticipate and respond to our customers’ needs in order to improve our competitiveness. For example, we have made significant investments in the development and promotion of new products, such as WestlawNext, Thomson Reuters Eikon and Thomson Reuters Elektron. In addition, we plan to grow by attracting new customers and expanding into new geographic markets such as Asia, Latin America and the Middle East. It may take us a significant amount of time and expense to develop new products, services, applications and functionalities to meet needs of customers, attract new customers or expand into new geographic markets. If we are unable to do so, our ability to generate revenues may be adversely affected.
In our Professional division, our customers have increasingly been seeking products and services delivered electronically and migrating away from higher margin print and CD products.
Thomson Reuters Annual Report 2010
18
We generate a significant percentage of our revenues from recurring subscription-based arrangements, and our ability to maintain existing revenues and to generate higher revenues is dependent in part on maintaining a high renewal rate.
In 2010, 86% of our revenues were derived from subscriptions or similar contractual arrangements, which result in recurring revenues. Our revenues are supported by a relatively fixed cost base that is generally not impacted by fluctuations in revenues. Our subscription arrangements are most often for a term of one year or renew automatically under evergreen arrangements. With appropriate notice, however, certain arrangements are cancelable quarterly, particularly within our Markets division. In addition, the renewals of longer-term arrangements are often at the customer’s option. In order to maintain existing revenues and to generate higher revenues, we are dependent on a significant number of our customers to renew their arrangements with us. Our revenues could also be lower if a significant number of our customers renewed their arrangements with us, but reduced the amount of their spending.
We rely heavily on network systems and the Internet and any failures or disruptions may adversely affect our ability to serve our customers.
We are dependent on our ability to handle rapidly substantial quantities of data and transactions on computer-based networks and the capacity, reliability and security of our electronic delivery systems and the Internet. Any significant failure or interruption of these systems, including operational services, loss of service from third parties, sabotage, break-ins, war, terrorist activities, human error, natural disaster, power or coding loss and computer viruses could cause our systems to operate slowly or interrupt service for periods of time and could have a material adverse effect on our business and results of our operations. Any breach of data security caused by one of these events could also result in unintentional disclosure of, or unauthorized access to, customer data or information, which could potentially result in additional costs, lost sales, penalties and litigation. Our ability to effectively use the Internet may be impaired due to infrastructure failures, service outages at third party Internet providers or increased government regulation. In addition, we are facing significant increases in our use of power and data storage. We may experience shortage of capacity and increased costs associated with such usage. These events may affect our ability to store, handle and deliver data and services to our customers.
From time to time, update rates of market data have increased. This can sometimes impact product and network performance. Factors that have significantly increased the market data update rates include:
|
|
—
|
the emergence of proprietary data feeds from other markets;
|
|
|
—
|
high market volatility;
|
|
|
—
|
decimalization;
|
|
|
—
|
reductions in trade sizes resulting in more transactions;
|
|
|
—
|
new derivative instruments;
|
|
|
—
|
increased automatically-generated algorithmic and program trading;
|
|
|
—
|
market fragmentation resulting in an increased number of trading venues; and
|
|
|
—
|
multiple listings of options and other securities.
|
Changes in legislation and regulation pertaining to market structure and dissemination of market information may also increase update rates. While we continue to implement a number of capacity management initiatives, there can be no assurance that our company and our network providers will be able to accommodate accelerated growth of peak traffic volumes or avoid other failures or interruptions.
We are dependent on third parties for information and other services.
We obtain significant information through licensing arrangements with content providers. In addition, we rely on third party service providers for telecommunications and certain human resources administrative functions. Some providers may seek to increase fees for providing their proprietary content or services. If we are unable to renegotiate commercially acceptable arrangements with these content or service providers or find alternative sources of equivalent content or service, our business could be adversely affected.
Thomson Reuters Annual Report 2010
19
We may be adversely affected by changes in legislation and regulation.
We may be impacted by legislative and regulatory changes that impact our customers’ industries, in particular customers of our Markets division and Healthcare & Science segment. In 2010, the Dodd-Frank Act was adopted in the United States and similar laws and regulations may be adopted in the future in other countries. Legal and regulatory changes may impact how we provide products and services to our customers. Existing and proposed legislation and regulations, including changes in the manner in which such legislation and regulations are interpreted by courts, may impose limits on our collection and use of certain kinds of information and our ability to communicate such information effectively to our customers in both the Professional and Markets divisions. Laws relating to communications, data protection, e-commerce, direct marketing and digital advertising and the use of public records have also become more prevalent in recent years. It is difficult to predict in what form laws and regulations will be adopted or how they will be construed by the relevant courts, or the extent to which any changes might adversely affect us. In addition, changes in tax laws and/or uncertainty over their application and interpretation may adversely affect our results. We operate in many countries worldwide and our earnings are subject to taxation in many different jurisdictions and at different rates. We seek to organize our affairs in a tax efficient manner, taking account of the jurisdictions in which we operate. Tax laws that apply to our company may be amended by the relevant authorities, for example, as a result of changes in fiscal circumstances or priorities. Such amendments, or their application to our company, may adversely affect our results.
Operating globally involves challenges that we may not be able to meet and that may adversely affect our ability to grow.
There are certain risks inherent in doing business globally which may adversely affect our business and ability to grow. These risks include difficulties in penetrating new markets due to established and entrenched competitors, difficulties in developing products and services that are tailored to the needs of local customers, lack of local acceptance or knowledge of our products and services, lack of recognition of our brands, unavailability of joint venture partners or local companies for acquisition, instability of international economies and governments, exposure to adverse government action in countries where we may conduct reporting activities, changes in laws and policies affecting trade and investment in other jurisdictions, and exposure to varying legal standards, including intellectual property protection laws. Adverse developments in any of these areas could cause our actual results to differ materially from expected results. However, there are also advantages to operating globally, including a proportionately reduced exposure to the market developments of a single country or region.
Our goodwill is key to our ability to remain a trusted source of information and news.
The integrity of our reputation is key to our ability to remain a trusted source of information and news. Failure to protect our brands or failure to uphold the Thomson Reuters Trust Principles may adversely impact our credibility as a trusted supplier of content and may have a negative impact on our information and news business.
We may be subject to impairment losses that would reduce our reported assets and earnings.
Goodwill and identifiable intangible assets comprise a substantial portion of our total assets. Economic, legal, regulatory, competitive, contractual and other factors may affect the value of goodwill and identifiable intangible assets. If any of these factors impair the value of these assets, accounting rules would require that we reduce their carrying value and recognize an impairment charge, which would reduce our reported assets and earnings in the year the impairment charge is recognized.
Our intellectual property rights may not be adequately protected, which may adversely affect our financial results.
Many of our products and services are based on information delivered through a variety of media, including online, dedicated transmission lines, mobile devices, software-based applications, books, journals and compact discs. We rely on agreements with our customers and patent, trademark, copyright and other intellectual property laws to establish and protect our proprietary rights in our products and services. Third parties may be able to copy, infringe or otherwise profit from our proprietary rights without authorization and the Internet may facilitate these activities. We also conduct business in some countries where the extent of effective legal protection for intellectual property rights is uncertain. We cannot assure you that we have adequate protection of our intellectual property rights. If we are not able to protect our intellectual property rights, our financial results may be adversely affected.
We operate in an increasingly litigious environment, which may adversely affect our financial results.
We may become involved in legal actions and claims arising in the ordinary course of business. Due to the inherent uncertainty in the litigation process, the resolution of any particular legal proceeding could have a material adverse effect on our financial position and results of operations.
Thomson Reuters Annual Report 2010
20
We are significantly dependent on technology and the rights related to it, including rights in respect of business methods. This, combined with the recent proliferation of “business method patents” issued by the U.S. Patent Office, and the increasingly litigious environment that surrounds patents in general, increases the possibility that we may be sued for patent infringement.
If an infringement suit were successful, it is possible that the infringing product would be enjoined by court order and removed from the market and we may be required to compensate the party bringing the suit either by a damages claim or through ongoing license fees or other fees, and such compensation could be significant, in addition to the legal fees that would be incurred defending such a claim. Responding to intellectual property claims, regardless of the validity, could also be time consuming and could require us to release source code to third parties, possibly under open source license terms.
Our credit ratings may be downgraded, which may impede our access to the debt markets or raise our borrowing rates.
Our access to financing depends on, among other things, suitable market conditions and the maintenance of suitable long-term credit ratings. Our credit ratings may be adversely affected by various factors, including increased debt levels, decreased earnings, declines in customer demands, increased competition, a further deterioration in general economic and business conditions and adverse publicity. Any downgrades in our credit ratings may impede our access to the debt markets or raise our borrowing rates.
Currency fluctuations and interest rate fluctuations may have a significant impact on our reported revenues and earnings.
Our financial statements are expressed in U.S. dollars and are, therefore, subject to movements in exchange rates on the translation of the financial information of businesses whose operational currencies are other than our reporting currency. We receive revenues and incur expenses in many currencies and are thereby exposed to the impact of fluctuations in various currency rates. To the extent that these currency exposures are not hedged, exchange rate movements may cause fluctuations in our consolidated financial statements.
Substantially all of our non-U.S. dollar-denominated debt has been hedged into U.S. dollars. Our hedging strategies against currency risk could also impact our financial results when the U.S. dollar strengthens against other currencies. In addition, an increase in interest rates from current levels could adversely affect our results in future periods.
If we do not continue to recruit and retain high quality management and key employees, we may not be able to execute our strategies.
The completion and execution of our strategies depends on our ability to continue to recruit and retain high quality management and employees across all of our businesses. We compete with many businesses that are seeking skilled individuals, including those with advanced technological abilities. We may not be able to continue to identify or be successful in recruiting or retaining the appropriate qualified personnel for our businesses and this may adversely affect our ability to execute our strategies. As greater focus has been placed on executive compensation at public companies, in the future, we may be required to alter our compensation practices in ways that could adversely affect our ability to attract and retain talented employees.
We have significant funding obligations for pension and post-retirement benefit arrangements that are affected by factors outside of our control.
We have significant funding obligations for various pension and other post-retirement benefit arrangements that are affected by factors outside of our control. The valuations of material plans are determined by independent actuaries. Long-term rates of return for pension plans and post-retirement benefit arrangements are based on evaluations of historical investment returns and input from investment advisors. These valuations and rates of return require assumptions to be made in respect of future compensation levels, expected mortality, inflation, the expected long-term rate of return on the assets available to fund the plans, the expected social security costs and medical cost trends, along with the discount rate to measure obligations. These assumptions are reviewed annually. While we believe that these assumptions are appropriate given current economic conditions, significant differences in results or significant changes in assumptions may materially affect pension plan and post-retirement benefit obligations and related future expenses.
Woodbridge controls our company and is in a position to affect our governance and operations.
Woodbridge beneficially owned approximately 55% of our shares as of March 1, 2011. For so long as Woodbridge maintains its controlling interest in our company, it will generally be able to approve matters submitted to a majority vote of our shareholders without the consent of other shareholders, including, among other things, the election of our board. In addition, Woodbridge may be able to exercise a controlling influence over our business and affairs, the selection of our senior management, the acquisition or disposition of our assets, our access to capital markets, the payment of dividends and any change of control of our company, such as a merger or take-over. The effect of this control may be to limit the price that investors are willing to pay for our shares. In addition, a sale of shares by Woodbridge or the perception of the market that a sale may occur may adversely affect the market price of our shares
Thomson Reuters Annual Report 2010
21
We may be unable to derive fully the anticipated benefits from our existing or future acquisitions, joint ventures, investments or dispositions.
We have acquired, invested in and/or disposed of, and in the future may seek to acquire, invest in and/or dispose of, various companies and businesses. In the future, we may not be able to successfully identify attractive acquisition opportunities or make acquisitions on terms that are satisfactory to our company from a commercial perspective. In addition, competition for acquisitions in the industries in which we operate during recent years has escalated, and may increase costs of acquisitions or cause us to refrain from making certain acquisitions. We may also be subject to increasing regulatory scrutiny from competition and antitrust authorities. Achieving the expected returns and synergies from past and future acquisitions will depend in part upon our ability to integrate the products and services, technology, administrative functions and personnel of these businesses into our segments in an efficient and effective manner. We cannot assure you that we will be able to do so, or that our acquired businesses will perform at anticipated levels. If we are unable to successfully integrate acquired businesses, our anticipated revenues and profits may be lower. Our strategies have historically resulted in decisions to dispose of assets or businesses that were no longer aligned with strategic objectives. We expend costs and management resources to complete divestitures. Any failures or delays in completing divestitures could have an adverse effect on our financial results and on our ability to execute our strategy.
Benefits from our integration program and other efficiency initiatives may not be achieved to the extent, or within the time period, currently expected.
In February 2011, we raised our combined run-rate savings target for our Reuters acquisition integration and legacy savings programs to $1.7 billion by year-end 2011. Our integration program and related efficiency initiatives involve investing in new revenue initiatives and transformation initiatives, including content and development transformation, common platform development, customer administration and data center rationalization. We may encounter difficulties during this process that could eliminate, reduce or delay the realization of the savings that are currently expected. Among other things, these difficulties could include:
|
|
—
|
unexpected issues, higher than expected costs and an overall process that takes longer than originally anticipated;
|
|
|
—
|
our inability to successfully integrate operations, technologies, products and services;
|
|
|
—
|
loss of key employees;
|
|
|
—
|
modification or termination of existing agreements with customers and suppliers and delayed entry into new agreements with prospective customers and suppliers; and
|
|
|
—
|
the diversion of management’s attention from day-to-day business or developing longer-term strategy as a result of the need to deal with integration and savings program issues.
|
As a result of these difficulties, the actual savings generated may be less, and may take longer to realize, than is currently expected.
Changes in the tax residence of our company could cause us adverse tax consequences.
We expect our company will remain resident only in Canada for tax purposes. However, if our company were to cease to be resident solely in Canada for tax purposes (including as a result of changes in applicable laws or in Canadian regulatory practice), this could cause us adverse tax consequences.
Thomson Reuters Founders Share Company holds a Thomson Reuters Founders Share in our company and may be in a position to affect our governance and management.
Thomson Reuters Founders Share Company was established to safeguard the Thomson Reuters Trust Principles, including the independence, integrity and freedom from bias in the gathering and dissemination of information and news. The Founders Share Company holds a Thomson Reuters Founders Share in our company. The interest of the Founders Share Company in safeguarding the Trust Principles may conflict with our other business objectives, impose additional costs or burdens on us or otherwise affect the management and governance. In addition, the Founders Share enables the Founders Share Company to exercise extraordinary voting power to safeguard the Trust Principles and to thwart those whose holdings of voting shares of Thomson Reuters threaten the Trust Principles. As a result, the Founders Share Company may prevent a change of control (including by way of a take-over bid or similar transaction) of our company in the future. The effect of these rights of the Founders Share Company may be to limit the price that investors are willing to pay for our shares.
Thomson Reuters Annual Report 2010
22
MANAGEMENT’S DISCUSSION AND ANALYSIS
This management’s discussion and analysis is designed to provide you with a narrative explanation of our financial condition and results of operations through the eyes of our management. We recommend that you read this in conjunction with our 2010 annual financial statements. We have organized our management’s discussion and analysis in the following key sections:
|
|
●
|
Overview – a brief discussion of our business;
|
|
|
|
|
●
|
Results of Operations – a comparison of our current and prior period results;
|
|
|
●
|
Liquidity and Capital Resources – a discussion of our financial position, cash flow and commitments;
|
|
|
●
|
Outlook – our current business and financial outlook for 2011;
|
|
|
●
|
Related Party Transactions – a discussion of transactions with our principal shareholder and others;
|
|
|
●
|
Subsequent Events – a discussion of material events occurring after December 31, 2010 and through the date of this management’s discussion and analysis;
|
|
|
●
|
Changes in Accounting Policies – a discussion of changes in our accounting policies and recent accounting pronouncements;
|
|
|
●
|
Critical Accounting Estimates and Judgments – a discussion of critical estimates and judgments made by our management in applying accounting policies;
|
|
|
●
|
Additional Information – other financial information and required disclosures; and
|
|
|
●
|
Appendices – supplemental information and discussion.
|
References in this discussion to “$” and “US$” are to U.S. dollars and references to “C$” are to Canadian dollars. Unless otherwise indicated or the context otherwise requires, references in this discussion to “we,” “our,” “us” and “Thomson Reuters” are to Thomson Reuters Corporation and our subsidiaries.
This management's discussion and analysis also contains forward-looking statements, which are subject to risks and uncertainties that could cause our actual results to differ materially from the forward-looking statements. Forward-looking statements include, but are not limited to, our expectations regarding:
|
|
●
|
General economic conditions and market trends and their anticipated effects on our business;
|
|
|
●
|
Our 2011 financial outlook;
|
|
|
●
|
Investments that we have made and plan to make;
|
|
|
●
|
Anticipated cost savings to be realized from our integration and legacy savings programs; and
|
|
|
●
|
Our liquidity and capital resources available to us to fund our ongoing operations, investments and returns to shareholders.
|
For additional information related to forward-looking statements and material risks associated with them, please see the section of this management’s discussion and analysis entitled “Cautionary Note Concerning Factors That May Affect Future Results”.
This management’s discussion and analysis is dated as of March 1, 2011.
Thomson Reuters Annual Report 2010
23
OVERVIEW
KEY HIGHLIGHTS
2010 was a year of execution and delivery for our company.
|
|
●
|
We returned to revenue growth;
|
|
|
●
|
Our markets continued to improve;
|
|
|
●
|
We launched new flagship products, which are gaining momentum;
|
|
|
●
|
We acquired foundational assets in higher-growth segments and global markets, particularly in rapidly developing economies; and
|
|
|
●
|
We continued to capture efficiencies through our integration and legacy savings programs.
|
Revenues – Our revenues from ongoing businesses (before currency(1) impacts) were $13.1 billion, a 1% increase. Our revenue growth exceeded our original 2010 outlook due to our focused efforts to seek revenue growth and improvement in the financial and legal services markets.
Underlying operating profit (1) – Our underlying operating profit was $2.6 billion, a decline of 7%. The related margin declined to 19.6% (20.0% before currency and acquisitions). These decreases reflected investments in new product launches and an unfavorable change in product mix, as well as the dilutive effect of acquisitions.
Underlying free cash flow (1) – We delivered underlying free cash flow of $2.0 billion, reflecting our highly cash flow generative business model.
New product launches – 2010 marked the expected high-water mark in a multi-year period of heavy capital expenditures, culminating in the launch of several key product platforms:
|
|
●
|
WestlawNext, our next generation legal research platform;
|
|
|
●
|
Thomson Reuters Eikon, our new flagship financial information platform;
|
|
|
●
|
ONESOURCE global tax workstation, which provides a new approach to global tax compliance;
|
|
|
●
|
Advantage Suite 5.0, our redesigned, state-of-the-art tools to support healthcare decision making; and
|
|
|
●
|
Thomson Reuters Elektron, our ultra low-latency electronic trading and data distribution platform.
|
Foundational acquisitions – In 2010, we spent approximately $0.9 billion on acquisitions. We invested in higher-growth areas like Governance, Risk and Compliance, Global General Counsel and emerging energy markets and we pursued global expansion through acquisitions in Brazil, India and other rapidly developing markets.
Integration programs – We achieved combined run-rate savings of approximately $1.4 billion from the Reuters integration and legacy savings programs. We expect to achieve aggregate run-rate savings target of $1.7 billion by the end of 2011, the final year of our integration programs, $100 million higher than our prior estimate of $1.6 billion.
Efficiency initiatives – We consolidated and integrated technology platforms, transformed the technology infrastructure of our data centers through standardization, virtualization and automation and rolled out new customer administration platforms.
In 2011, our priorities remain Growth & Efficiency. We plan to drive customer adoption of our 2010 product launches and accelerate growth by leveraging our newly acquired foundational assets and pursuing targeted investments. While 2011 marks the formal end to our integration programs, we expect to continue to capture efficiencies through technology initiatives as well as streamlining products, processes and our organization.
For more information regarding our 2010 financial performance and 2011 outlook as well as the basis of presentation for the above financial information, see the sections entitled “Results of Operations” and “Outlook” below. For more information about our strategic objectives, please see the “Business” section of this annual report.
|
(1)
|
Refer to Appendix A for additional information on non-IFRS financial measures.
|
Thomson Reuters Annual Report 2010
24
OUR BUSINESS AND STRATEGY
Who we are and what we do – We are the leading source of intelligent information for businesses and professionals. We combine industry expertise with innovative technology to deliver critical information to leading decision-makers. Through over 55,000 people in over 100 countries, we deliver this must-have insight to the financial, legal, tax and accounting, healthcare and science and media markets, powered by the world’s most trusted news organization.
How we make money – We serve a wide variety of customers with a single, tested business model. We derive the majority of our revenues from selling electronic content and services to professionals, primarily on a subscription basis. Over the years, this has proven to be capital efficient and cash flow generative, and it has enabled us to maintain leading and scalable positions in our chosen markets. Within each of the markets we serve, we bring in-depth understanding of our customers’ needs, flexible technology platforms, proprietary content and scale. We believe our ability to embed our solutions into customers’ workflows is a significant competitive advantage as it leads to strong customer retention.
Our operational structure — We are organized in two divisions:
|
|
●
|
Professional, which consists of our legal, tax and accounting, and healthcare and science businesses; and
|
|
|
●
|
Markets, which consists of our financial and media businesses.
|
We also report a Corporate & Other category that principally includes corporate expenses, certain share-based compensation costs, certain fair value adjustments and expenses for our integration programs.
REVENUES
Our revenues are derived from a diverse customer base, with our largest customer accounting for approximately 1% of our revenues in 2010 and 2009.
Below, we provide information regarding our 2010 revenues by media, type and geographic area.

|
(1)
|
Based on revenues from ongoing businesses; refer to Appendix A for information on this measure.
|
By media. We deliver most of our information online through the Internet and dedicated transmission lines and to mobile devices. Electronic delivery improves our ability to rapidly provide additional products and services to our existing customers and to access new customers around the world. In addition, our offerings often combine software and services as integrated solutions to better serve the workflow needs of our customers. We also distribute our information in print format. Increasingly, our customers have been purchasing products and services delivered electronically and have migrated away from print products.
In 2010, approximately 91% (2009: 90%) of our revenues were derived from information delivered electronically, software and services. Within our portfolio, software and services tend to be less capital intensive, have high growth rates and yield a higher return on investment than print products. However, print products typically have a higher incremental profit margin than software and services. Changes in our revenue mix impact our operating margins. We expect that our customers will continue to prefer online delivery, particularly as rapidly developing economies increasingly incorporate technology into their workflows, and we expect to continue to add more solution-based and software-based businesses to our portfolio in response.
Thomson Reuters Annual Report 2010
25
By type. We believe that one of the competitive advantages of our business is our recurring revenue model. By recurring, we mean that we derive a significant percentage of our revenues from subscription or similar contractual arrangements, which customers tend to renew from year to year. Recurring revenues were 86% in both 2010 and 2009. Recurring revenues include recoveries, which are low margin revenues we collect and pass through to a third party provider, such as stock exchange fees.
Because a high proportion of our revenues are recurring, we believe that our revenue patterns are generally more stable compared to other business models that primarily involve the sale of products in discrete or one-off arrangements. However, this also means that there is a lag in realizing the impact of current sales or cancellations in our reported revenues, as we recognize revenues over the term of the arrangement. Because of this lag effect, we reported revenue growth through much of 2009, even as net sales (gross sales less cancellations) were negative. Similarly, our revenues were slower to return to growth in 2010 compared to other businesses that are not subscription-based, despite our positive net sales throughout 2010.
Our subscription arrangements are most often for a term of one year or renew automatically under evergreen arrangements. With appropriate notice, certain arrangements are cancelable quarterly, particularly within our Markets division. A significant portion of our arrangements are for three year terms or longer, after which they automatically renew or are renewable at the customer’s option. Renewal dates are spread over the course of the year. In the case of some of our subscription arrangements, we realize additional fees based upon usage.
By geography. We segment our revenues geographically by origin of sale. Our geographic segments are Americas, EMEA (Europe, Middle East and Africa) and Asia. In both 2010 and 2009, revenues were 59% from the Americas, 30% from EMEA and 11% from Asia. In the long-term, we expect that our revenues from Asia, Latin America and the Middle East will increase as the number of professionals in those markets continues to grow and as we continue execution of our globalization strategy.
We can modify and offer globally many of the products and services we have developed originally for customers of a given market. For various global products, we use a common database platform that supports multiple applications. This allows us to deploy products quickly into numerous countries, especially where we provide country or industry-specific information that is combined with data that is used in other Thomson Reuters products. This represents an opportunity for us to earn incremental revenues. For some of the products and services we sell globally, we incur additional costs to customize our products and services for the local market and this can result in lower margins if we cannot achieve adequate scale.
Because of the dynamic nature of our products and services, we do not analyze our revenue base using traditional price versus volume measurements.
EXPENSES
A majority of our expenses are fixed. As a result, when our revenues increase, we become more profitable and our margins increase. When our revenues decline, we become less profitable. Our most significant operating expense is staff costs. Staff costs are comprised of salaries, bonuses, commissions, benefits, payroll taxes and share-based compensation and represented approximately 52% of our 2010 operating expenses (2009: 51%), excluding the effects of fair value adjustments. Goods and services comprise the next largest category, comprising approximately 27% of our 2010 operating expenses (2009: 26%). See “Operating expenses” for additional information.
SEASONALITY
Our revenues and operating profits do not tend to be significantly impacted by seasonality as we record a large portion of our revenues ratably over a contract term and our costs, excluding integration programs expenses, are generally incurred evenly throughout the year. However, our non-recurring revenues can cause changes in our performance from quarter to consecutive quarter. Additionally, the release of certain print-based offerings can be seasonal as can certain product releases for the regulatory markets, which tend to be concentrated at the end of the year.
ACQUISITIONS AND DISPOSITIONS
Acquisitions have always played a key role in our corporate strategy. Our acquisitions are generally tactical in nature and primarily relate to the purchase of information, products or services that we integrate into our operations to broaden the range of our offerings in order to better serve our customers and expand our markets outside of the United States. When integrating acquired businesses, we focus on eliminating cost redundancies and combining the acquired products and services with our existing offerings and capabilities to achieve revenue growth.
Thomson Reuters Annual Report 2010
26
The following charts provide additional information about our acquisitions:

|
|
(1)
|
Cash consideration for acquisitions and investments in businesses, including cash acquired.
|
Acquisition spending (including cash acquired) was approximately $0.9 billion in 2010, compared to approximately $0.4 billion in 2009. Nearly 50% of our acquisitions in both 2010 and 2009 were completed outside of the U.S., reflecting our focus on globalization. Newly acquired businesses increased our 2010 revenues by 2%, primarily in our Professional division. Generally, the businesses we acquire initially have lower margins than our existing businesses.
The following were key acquisitions completed in 2010 by division:
|
Acquirer
|
Company
|
Description
|
||
|
Professional:
|
||||
|
Legal
|
Complinet
|
A provider of global compliance information solutions for financial services institutions and their advisors
|
||
|
Legal
|
Serengeti
|
A provider of electronic billing and matter management systems for corporate legal departments
|
||
|
Legal
|
Pangea3
|
A provider of legal process outsourcing services
|
||
|
Legal
|
Revista dos Tribunais
|
A Brazilian legal publisher
|
||
|
Legal
|
Canada
Law Book
|
A Canadian legal publisher
|
||
|
Healthcare & Science
|
GeneGo
|
A provider of biology and disease information, analytics, and decision support solutions for pharmaceutical research and development
|
||
|
Markets:
|
||||
|
Sales & Trading
|
Point Carbon
|
A provider of essential trading analytics, news and content for the energy and environmental markets
|
||
|
Sales & Trading
|
Tradeweb
New Markets (1)
|
A multi-asset class over-the-counter trading platform
|
||
|
Sales & Trading
|
Aegisoft
|
A provider of electronic trading solutions and testing tools
|
(1) Transaction completed largely through an exchange of equity interests as described in the section entitled “Tradeweb”.
As part of our continuing strategy to optimize our portfolio of businesses and to ensure that we are investing in the parts of our business that offer the greatest opportunities to achieve higher growth and returns, we sell businesses from time to time that are not fundamental to our strategy. While there were no significant divestitures in 2010, we recently announced that we intend to sell BARBRI, our legal education business that provides bar exam preparation services in the U.S., as well as our Scandinavian legal and tax accounting business. See “Subsequent Events” for additional information.
INTEGRATION PROGRAMS
2010 was the third year of our integration program related to the Reuters acquisition. The major initiatives associated with the program in 2010 related to:
|
|
●
|
Realizing cost synergies through headcount reductions;
|
Thomson Reuters Annual Report 2010
27
|
|
●
|
Retiring legacy products and systems;
|
|
|
●
|
Consolidating data centers;
|
|
|
●
|
Rolling out new strategic products; and
|
|
|
●
|
Capturing revenue synergies.
|
The following charts summarize the run-rate savings we have achieved through 2010 and the annual savings (including legacy efficiency programs) that we expect to achieve by completion of the program at the end of 2011, as well as the actual and projected costs to achieve these savings levels.
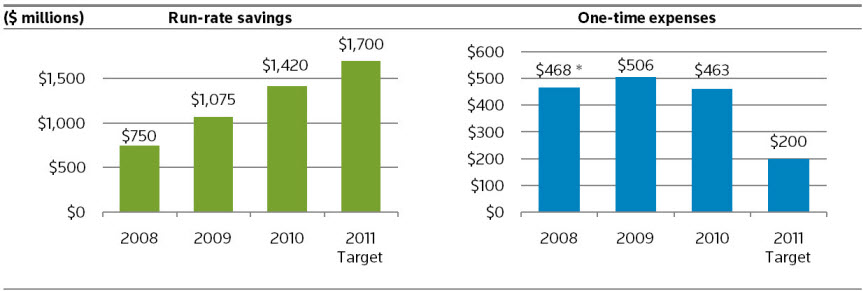
* Total costs exclude $68 million of Reuters transaction-related expenses incurred in 2008.
The incremental run-rate savings achieved in 2010 are attributable to retiring legacy products, execution of our new sales and customer service programs, as well as consolidation of communications, content and data centers within the Markets division. As a result of our continued progress, we recently increased our 2011 aggregate savings target to $1.7 billion, which is $100 million higher than our prior estimate.
We expect to spend $200 million on integration programs in 2011, which is $75 million more than our prior estimate due to funding of additional savings opportunities. We expect total one-time expenses of $1.6 billion associated with these programs. Integration expenses primarily include severance and consulting expenses as well as costs associated with certain technology initiatives and branding. Because these are corporate initiatives, integration expenses are reported within Corporate & Other.
USE OF NON-IFRS FINANCIAL MEASURES
In addition to our results reported in accordance with International Financial Reporting Standards (IFRS), we use certain non-IFRS financial measures as supplemental indicators of our operating performance and financial position and for internal planning purposes. These non-IFRS measures include:
|
|
●
|
Revenues from ongoing businesses;
|
|
|
●
|
Revenues at constant currency (before currency or revenues excluding the effects of foreign currency);
|
|
|
●
|
Operating profit from ongoing businesses;
|
|
|
●
|
Underlying operating profit and underlying operating profit margin;
|
|
|
●
|
Adjusted earnings and adjusted earnings per share from continuing operations;
|
|
|
●
|
Net debt;
|
|
|
●
|
Free cash flow;
|
|
|
●
|
Underlying free cash flow;
|
|
|
●
|
Return on invested capital; and
|
|
|
●
|
Adjusted EBITDA.
|
We have historically reported non-IFRS financial measures as we believe their use provides more insight into our performance. Please see Appendix A for a description of our non-IFRS financial measures, including an explanation of why we believe they are useful measures of our performance, including our ability to generate cash flow. Non-IFRS financial measures are unaudited. See the sections entitled “Results of Operations”, “Liquidity and Capital Resources” and Appendices B and C for reconciliations of these non-IFRS measures to the most directly comparable IFRS measures.
Thomson Reuters Annual Report 2010
28
RESULTS OF OPERATIONS
BASIS OF PRESENTATION
Below, we discuss our results from continuing operations as presented in our income statement. Our results from continuing operations include the performance of acquired businesses from the date of their purchase and exclude results from businesses classified as discontinued operations.
We measure the performance of our ongoing businesses. Ongoing businesses exclude discontinued operations and the results of disposals. Disposals are businesses sold or held for sale that could not be classified as discontinued operations. We recently announced our intention to sell our Professional division’s BARBRI legal education business and Scandinavian Legal and Tax & Accounting businesses, both of which are expected to close in the first half of 2011. As we managed these businesses for the full year 2010 and they were included as part of our 2010 business outlook, they are included in our analysis of results of operations. Appendix B to this management’s discussion and analysis contains a supplemental schedule of financial information which excludes the results of these planned disposals. See “Subsequent Events” for additional information.
In analyzing our revenues, we measure the performance of existing businesses and the impact of acquired businesses on a constant currency basis. We separately identify the effect of foreign currency on our reported revenues.
CONSOLIDATED RESULTS
The following table provides a summary of our results for 2010 and 2009:
|
Year ended December 31,
|
|||||||||||
|
(millions of U.S. dollars, except per share amounts)
|
2010
|
2009
|
Change
|
||||||||
|
IFRS Financial Measures
|
|||||||||||
|
Revenues
|
13,070 | 12,997 | 1% | ||||||||
|
Operating profit
|
1,419 | 1,575 | (10%) | ||||||||
|
Diluted earnings per share
|
$ | 1.08 | $ | 1.01 | 7% | ||||||
|
Non-IFRS Financial Measures
|
|||||||||||
|
Revenues from ongoing businesses
|
13,069 | 12,948 | 1% | ||||||||
|
Underlying operating profit
|
2,560 | 2,754 | (7%) | ||||||||
|
Underlying operating profit margin
|
19.6 | % | 21.3 | % | (170) bp | ||||||
|
Adjusted earnings per share from continuing operations
|
$ | 1.76 | $ | 1.85 | (5%) | ||||||
bp= basis points.
Foreign currency effects. With respect to the average foreign exchange rates we use to report our results, the U.S. dollar strengthened against the Euro in 2010 compared to 2009, but remained constant against the British pound sterling. The U.S. dollar weakened against other major currencies in 2010. Given our currency mix of revenues and expenses around the world, these fluctuations did not impact our revenues, but had a negative impact on underlying operating profit margin.
Revenues. The following table provides information about our revenues:
|
Year ended December 31,
|
Percentage change: | ||||||||||||||||||||||
|
(millions of U.S. dollars)
|
2010
|
2009
|
Existing businesses
|
Acquired businesses
|
Constant currency
|
Foreign currency
|
Total
|
||||||||||||||||
|
Revenues from ongoing businesses
|
13,069 | 12,948 | (1%) | 2% | 1% | - | 1% | ||||||||||||||||
|
Revenues from disposals
|
1 | 49 | n/m | n/m | n/m | n/m | n/m | ||||||||||||||||
|
Revenues
|
13,070 | 12,997 | n/m | n/m | n/m | n/m | 1% | ||||||||||||||||
n/m = not meaningful.
In 2010, revenues from ongoing businesses, on a constant currency basis, reflected strong growth from the Enterprise business in Markets, and within Professional, from Tax & Accounting, Healthcare & Science and the subscription businesses in Legal. Acquisitions also contributed to higher revenues. These increases were partially offset by softness in Legal print and non-subscription revenues and a decline in Sales & Trading and Investment & Advisory revenues in Markets. The decline in the Investment & Advisory business largely relates to Investment Management, as a result of cancellations from buy-side customers seeking to cut costs or exit the business entirely and competitive pressures. Sales & Trading revenues were lower due to the impact of 2009 negative net sales. Revenues from these two Markets division units were also impacted by strategic decisions to retire legacy products.
Thomson Reuters Annual Report 2010
29
Given the subscription nature of our business, the impact from net sales on our reported revenues tends to lag the economic cycle. Because of the lag effect, our revenues were slower to return to growth in 2010 compared to other businesses that are not subscription-based. On a consolidated basis, net sales were positive in the fourth quarter of 2010, the fifth consecutive quarter of positive net sales. This improved sales performance in 2010, compared to negative net sales in 2009, was reflected through improving revenue trends as 2010 progressed as shown in the following chart:
Revenue Growth Rate
(revenues from ongoing businesses)
(% change before currency)
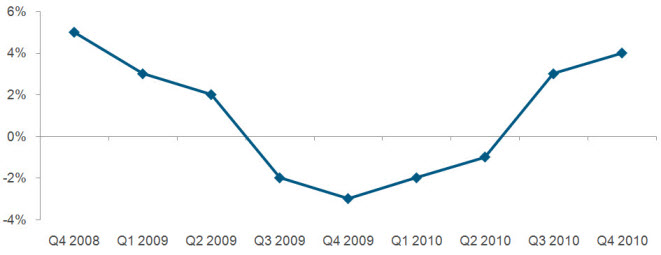
Operating profit. The following table provides information about our operating profit, including a reconciliation to underlying operating profit:
|
Year ended December 31,
|
||||||||||||
|
(millions of U.S. dollars)
|
2010
|
2009
|
Change
|
|||||||||
|
Operating profit
|
1,419 | 1,575 | (10 | %) | ||||||||
|
Adjustments:
|
||||||||||||
|
Amortization of other identifiable intangible assets
|
545 | 499 | ||||||||||
|
Integration programs expenses
|
463 | 506 | ||||||||||
|
Fair value adjustments
|
117 | 170 | ||||||||||
|
Other operating losses (gains), net
|
16 | (9 | ) | |||||||||
|
Disposals
|
- | 13 | ||||||||||
|
Underlying operating profit
|
2,560 | 2,754 | (7 | %) | ||||||||
|
Underlying operating profit margin
|
19.6 | % | 21.3 | % | (170 | ) bp | ||||||
bp = basis points.
Operating profit decreased, reflecting investments in new products launched during 2010, unfavorable product mix and higher amortization of other identifiable intangible assets from newly acquired businesses. These factors outweighed benefits from integration programs, efficiency initiatives, lower integration programs expenses and lower depreciation and amortization expense from certain assets acquired with Reuters becoming fully depreciated.
Similarly, underlying operating profit and the corresponding margin decreased due to investments in new products and unfavorable product mix, which more than offset benefits from integration programs, efficiency initiatives and lower depreciation and amortization expense from certain assets acquired with Reuters becoming fully depreciated. Underlying operating profit margin included a 130 basis points impact from investments in new product launches and unfavorable product mix and a 40 basis points impact due to lower initial margins from acquisitions and unfavorable foreign currency.
Thomson Reuters Annual Report 2010
30
Operating expenses. The following table provides information about our operating expenses:
|
Year ended December 31,
|
|||||||||||
|
(millions of U.S. dollars)
|
2010
|
2009
|
Change
|
||||||||
|
Operating expenses
|
10,061 | 9,875 | 2% | ||||||||
|
Remove:
|
|||||||||||
|
Fair value adjustments
|
(117 | ) | (170 | ) | |||||||
|
Operating expenses, excluding fair value adjustments
|
9,944 | 9,705 | 2% | ||||||||
Operating expenses (excluding fair value adjustments) increased modestly in 2010. We believe it is better to evaluate our operating expenses excluding fair value adjustments as they distort the trends of our operating expenses. Fair value adjustments primarily represent non-cash accounting adjustments from the revaluation of embedded foreign exchange derivatives within certain customer and vendor contracts due to fluctuations in foreign exchange rates. Integration-related savings and tight cost controls have mitigated increases in operating expense despite investments in growth initiatives. Staff costs, which include salaries, bonuses, commissions, benefits, payroll taxes and share-based compensation, represented approximately 52% of our expenses in 2010 compared to 51% in 2009. Staff costs increased 4% in 2010, reflecting additional costs associated with acquisitions and new product development. Operating expenses in 2010 also reflected lower costs associated with a decrease in recoveries revenues (which are low-margin revenues we collect and pass through to a third party provider, such as stock exchange fees) in our Markets division.
Depreciation and amortization.
|
Year ended December 31,
|
|||||||||||
|
(millions of U.S. dollars)
|
2010
|
2009
|
Change
|
||||||||
|
Depreciation
|
457 | 509 | (10%) | ||||||||
|
Amortization of computer software
|
572 | 548 | 4% | ||||||||
|
Amortization of other identifiable intangible assets
|
545 | 499 | 9% | ||||||||
|
|
●
|
Depreciation. The decrease reflected that certain assets acquired in the Reuters acquisition are now fully depreciated. This impact more than offset increases from new capital expenditures.
|
|
|
●
|
Amortization of computer software. The increase reflected higher amortization attributable to investments in recently launched products such as Thomson Reuters Eikon and WestlawNext, investments in growth initiatives and assets of newly-acquired businesses.
|
|
|
●
|
Amortization of other identifiable intangible assets. The increase was due to amortization from newly-acquired assets, which more than offset decreases from the completion of amortization for certain identifiable intangible assets acquired in previous years.
|
Other operating (losses) gains, net. In 2010, other operating losses, net of $16 million were primarily comprised of a settlement in connection with a vendor dispute and acquisition-related expenses, which were partially offset by gains from the sale of certain investments and a gain from re-measuring our investment in Tradeweb New Markets (TWNM). See “Tradeweb” for additional information.
In 2009, other operating gains, net, of $9 million were primarily comprised of a $30 million gain on the sale of a wholly owned subsidiary to a company affiliated with Woodbridge. See “Related Party Transactions” for additional information. This gain was partially offset by losses associated with businesses we sold.
Net interest expense. Net interest expense was $383 million and $410 million in 2010 and 2009, respectively. The decrease reflected lower average debt levels and the benefit of lower interest charges resulting from our recent debt redemptions and our floating rate debt (after swaps). These decreases were partially offset by higher interest charges related to uncertain tax positions. Net interest expense in 2009 was also impacted by interest on $610 million of debt which we issued in March 2009, the net proceeds of which we used to repay other debt securities in June, August and December 2009.
Other finance income (costs). Other finance income was $28 million in 2010 compared to other finance costs of $242 million in 2009. The primary reason for the variance related to the impact of changes in foreign currency exchange rates on certain intercompany funding arrangements which resulted in income in 2010 and expense in 2009. We also incurred losses of $62 million and $35 million in 2010 and 2009, respectively, in connection with our early redemption of debt securities, principally representing premiums paid for early extinguishment. See “Financial Position” for additional information on debt repayments. Both periods also included losses related to freestanding derivative instruments.
Other non-operating charge. In 2009, in conjunction with the recognition of tax losses that had been acquired in a business combination, we recorded a $385 million reduction to goodwill. We recorded the reduction to goodwill as expense below operating profit because the accounting adjustment was not reflective of our core operating results.
Thomson Reuters Annual Report 2010
31
Tax (expense) benefit. As a global company, our income taxes depend on where we generate revenues around the world, the laws of numerous countries where we operate and applicable tax treaties between these countries. In 2010, we recorded income tax expense of $139 million, which included $47 million of discrete tax benefits relating primarily to the reversals of uncertain tax contingencies established through acquisition accounting and reductions in deferred tax liabilities resulting from lower jurisdictional tax rates. In 2009, we recorded an income tax benefit of $299 million, which included the following items:
|
|
●
|
The release of a $496 million deferred tax liability related to an intercompany sale of an asset. There was no cash impact from this transaction as the sale was completed in a tax free manner.
|
|
|
●
|
A $35 million tax benefit for intercompany interest payments not previously considered to be deductible for tax purposes. The recognition of the benefit was a result of negotiations with tax authorities.
|
Our effective tax rate on earnings from continuing operations in 2010 was 13% compared to a benefit of 54.9% in 2009. Excluding the tax benefits discussed above from each period, as well as all items impacting adjusted earnings and tax thereon, our 2010 effective tax rate on adjusted earnings was 18.6% compared to 21% in 2009. These effective rates compared to the current Canadian corporate income tax rate of 30.5% (2009: 32.3%).
Our effective income tax rate in both years was lower than the Canadian corporate income tax rate due principally to the lower tax rates and differing tax rules applicable to certain of our operating and financing subsidiaries outside Canada. Specifically, while we generate revenues in numerous jurisdictions, the tax provision on earnings is computed after taking account of intercompany interest and other charges and credits among subsidiaries resulting from their capital structure and from the various jurisdictions in which operations, technology and content assets are owned. For these reasons, the effective tax rate differs from the Canadian corporate tax rate.
We expect our businesses to continue with initiatives to consolidate the ownership of their technology platforms and content, and we expect that a proportion of our profits will continue to be taxed at rates lower than the Canadian statutory tax rate. Additionally, our effective tax rate and our cash tax cost in the future will depend on the laws of numerous countries and the provisions of multiple income tax conventions between various countries in which we operate. Our ability to maintain our low effective tax rate will be dependent upon such laws and conventions remaining unchanged or favorable, as well as the geographic mix of our profits. See the section entitled “Contingencies” for further discussion of income tax liabilities.
Net earnings and earnings per share. Net earnings were $933 million in 2010 compared to $867 million in 2009. Diluted earnings per share were $1.08 in 2010 compared to $1.01 in 2009. Increased earnings and earnings per share primarily reflected significantly higher other finance costs and a non-operating charge in 2009, partially offset by lower operating profit and higher tax expense in the current year.
Adjusted earnings and adjusted earnings per share from continuing operations. The following table presents our adjusted earnings calculation:
|
Year ended December 31,
|
|||||||||||
|
(millions of U.S. dollars, except per share amounts)
|
2010
|
2009
|
Change
|
||||||||
|
Earnings attributable to common shareholders
|
909 | 844 | 8% | ||||||||
|
Adjustments:
|
|||||||||||
|
Disposals
|
- | 13 | |||||||||
|
Fair value adjustments
|
117 | 170 | |||||||||
|
Other operating losses (gains), net
|
16 | (9 | ) | ||||||||
|
Other finance (income) costs
|
(28 | ) | 242 | ||||||||
|
Other non-operating charge
|
- | 385 | |||||||||
|
Share of post-tax earnings in equity method investees
|
(8 | ) | (7 | ) | |||||||
|
Tax on above
|
(32 | ) | (40 | ) | |||||||
|
Amortization of other identifiable intangible assets
|
545 | 499 | |||||||||
|
Discrete tax items (1)
|
(47 | ) | (531 | ) | |||||||
|
Discontinued operations
|
- | (23 | ) | ||||||||
|
Dividends declared on preference shares
|
(3 | ) | (2 | ) | |||||||
|
Adjusted earnings from continuing operations
|
1,469 | 1,541 | (5%) | ||||||||
|
Adjusted earnings per share from continuing operations
|
$ | 1.76 | $ | 1.85 | (5%) | ||||||
|
(1)
|
In 2009, discrete tax items include a $496 million tax benefit. See “Tax (expense) benefit” for additional information.
|
Adjusted earnings and adjusted earnings per share from continuing operations decreased in 2010 due to lower underlying operating profit resulting from investments in new products launched in 2010, unfavorable product mix and the dilutive effect of acquisitions. Foreign currency negatively impacted adjusted earnings per share by $0.02. These decreases more than offset lower integration programs expenses, a decrease in net interest expense and lower income tax expense.
Thomson Reuters Annual Report 2010
32
SEGMENT RESULTS
A discussion of the operating results of each of our segments follows. We measure the performance of our segments excluding disposals, which are businesses sold or held for sale that do not qualify for discontinued operations classification. In addition, our definition of segment operating profit as reflected below may not be comparable to that of other companies. We define segment operating profit as operating profit before (i) amortization of other intangible assets; (ii) other operating gains and losses and (iii) certain asset impairment charges. We use this measure for our segments because we do not consider these excluded items to be controllable operating activities for purposes of assessing the current performance of our segments. We also use segment operating profit margin, which we define as segment operating profit as a percentage of revenues.
Professional division
The following tables summarize our Professional division revenues and operating profit for 2010 and 2009:
|
Year ended December 31,
|
Percentage change: | ||||||||||||||||||||||
|
(millions of U.S. dollars)
|
2010
|
2009
|
Existing
businesses
|
Acquired
businesses
|
Constant currency
|
Foreign
currency
|
Total
|
||||||||||||||||
|
Revenues from ongoing businesses
|
5,637 | 5,421 | 1% | 3% | 4% | - | 4% | ||||||||||||||||
|
Revenues from disposals (1)
|
1 | 49 | n/m | n/m | n/m | n/m | n/m | ||||||||||||||||
|
Revenues
|
5,638 | 5,470 | n/m | n/m | n/m | n/m | 3% | ||||||||||||||||
|
Year ended December 31,
|
|||||||||||
|
(millions of U.S. dollars)
|
2010
|
2009
|
Change
|
||||||||
|
Operating profit from ongoing businesses
|
1,472 | 1,554 | (5%) | ||||||||
|
Operating loss from disposals (1)
|
- | (13 | ) | ||||||||
|
Operating profit
|
1,472 | 1,541 | (4%) | ||||||||
|
Operating profit margin for ongoing businesses
|
26.1 | % | 28.7 | % | (260) bp | ||||||
|
Operating profit margin
|
26.1 | % | 28.2 | % | (210) bp | ||||||
| (1) | Comprised of PLM (a drug information provider in Latin America) sold in 2010 as well as PDR (Physicians’ Desk Reference) and Liquent both sold in 2009, all within our Healthcare & Science segment. |
n/m = not meaningful; bp = basis points.
The following discussion regarding our performance is related to our ongoing businesses and excludes the results of disposals completed in 2010 and 2009. The Professional division’s BARBRI legal education business and the Scandinavian Legal and Tax & Accounting businesses, which were announced for sale in 2011, are included in these results as they were included as part of our 2010 business outlook.
Revenues from ongoing businesses increased on a constant currency basis driven by solid growth from Legal subscriptions, Tax & Accounting and Healthcare & Science products and acquisitions, partially offset by declines in Legal print and non-subscription products. Tax & Accounting, Legal’s subscription-based offerings, and Healthcare & Science reported a combined revenue increase of 6% and represented approximately 78% of total Professional division revenues, including the benefit of acquired businesses. These increases were partially offset by decreases in Legal’s print revenues and non-subscription businesses, which both decreased 6% and 3%, respectively. Although revenues from print and non-subscription offerings continued to be lower than the prior year period, print attrition has slowed and is nearing historical levels. There continue to be selected areas of revenue growth within our non-subscription businesses, such as our Intellectual Property (trademark search) business, although ancillary revenues continued to decrease. We believe the increase in trademark searches is a sign of continued economic recovery in our markets.
Operating profit from ongoing businesses and the related margin decreased due to unfavorable revenue mix from lower revenues associated with high margin print and non-subscription products in our Legal segment (100 basis points); continued product investment (60 basis points); dilution from acquisitions which generally have lower initial margins (80 basis points); and unfavorable foreign currency (20 basis points). Lower 2009 net sales in the Legal segment also affected the Professional division’s performance in 2010, although this impact became less pronounced as the year progressed due to an improving sales environment. These factors more than offset the benefits of efficiency initiatives. The decrease in operating profit margin was consistent with the Professional division's 2010 outlook originally communicated in our 2009 annual management's discussion and analysis.
Thomson Reuters Annual Report 2010
33
2011 Outlook
The Professional division enters 2011 with good momentum having launched three major product platforms in 2010, invested in higher-growth areas and expanded its geographic footprint. Further, the business environment for customers of our Professional division improved in 2010 as law firm profits benefited from prior cost cutting and layoffs subsided. However, the economic recovery in developed markets remains fragile and there is uncertainty about government stimulus spending and deficit reduction measures. We expect rapidly developing economies will continue to grow faster than developed markets. We expect that regulation, compliance and risk management as well as a continuing focus on cost management and productivity improvement will continue to be key market forces.
In 2011, the Professional division plans to drive customer adoption of recent product launches, WestlawNext; ONESOURCE global tax workstation in Tax & Accounting; and Advantage Suite 5.0 in Healthcare & Science. We expect the Professional division’s high-margin print and transactional revenues to be relatively unchanged from 2010. We anticipate the continued evolution of our Professional division’s business mix towards workflow solutions and increased focus on global growth, particularly as rapidly developing economies continue to professionalize and as we extend our platforms to new markets. The Professional division also expects to continue to execute on efficiency initiatives to improve our technology infrastructure and source certain functions from lower cost locations. Over the long-term, we believe these activities will strengthen the competitive position of the Professional division.
For the past few years, the Professional division has been executing a strategy of expansion into higher growth markets and businesses, which has impacted its operating margin in the short term. In the longer term, we expect that the Professional division will return to historic operating margins in the high 20 percent range.
An outlook for each segment of the Professional division is provided below.
Legal
|
Year ended December 31,
|
Percentage change:
|
||||||||||||||||||||||||||
|
(millions of U.S. dollars)
|
2010
|
2009
|
Existing businesses
|
Acquired businesses
|
Constant currency
|
Foreign currency
|
Total
|
||||||||||||||||||||
|
Revenues
|
3,677 | 3,586 | - | 2% | 2% | 1% | 3% | ||||||||||||||||||||
|
Segment operating profit
|
1,058 | 1,155 | (8%) | ||||||||||||||||||||||||
|
Segment operating profit margin
|
28.8 | % | 32.2 | % | (340) bp | ||||||||||||||||||||||
bp = basis points.
Revenues increased on a constant currency basis. Given the subscription nature of our business, the impact from lower, but still positive, net sales in 2009 on our Legal segment’s reported revenues tends to lag the economic cycle. This dynamic impacted the Legal segment’s revenue growth rate in 2010, although the effects became less pronounced as the year progressed due to improving net sales trends. Legal also increased its revenue base through both tactical and strategic acquisitions in higher-growth markets, expanding its product offerings and global reach.
Revenues from subscription offerings, which include Westlaw and other businesses, increased 6%. Subscription growth was led by Legal’s international businesses which increased 8% (including contributions from Revista dos Tribunais and Canada Law Book, which we acquired in May and August 2010, respectively) and FindLaw which increased 18% (including contributions from Super Lawyers, which we acquired in February 2010). Complinet, a provider of global compliance solutions in the Governance, Risk and Compliance market, which we acquired in June 2010, also contributed to revenue growth. Increases from subscription offerings were offset by lower print and non-subscription revenues, which declined 6% and 3%, respectively, due to tightened customer budgets. However, the print attrition rate slowed substantially during 2010 and is nearing historical levels. Within Legal’s non-subscription businesses, revenues from trademark searches increased, a sign of continued economic recovery. However, Legal experienced double-digit declines in Westlaw ancillary revenues as customers tightly controlled spending above their base subscription contracts.
Segment operating profit and the related margin decreased reflecting lower revenues from high-margin print and non-subscription products and the impact of acquisitions and investments in strategic growth initiatives, which more than offset savings from efficiency initiatives.
Thomson Reuters Annual Report 2010
34
2011 Outlook
There was general improvement in the business environment for our Legal customers during 2010. In particular, rapidly developing economies, including India, China and Brazil are experiencing significant growth in the legal profession. However, law firms and government agencies in almost all developed countries are under increasing pressure to reduce costs and create new business models. Corporate counsel at companies are also managing their activities more efficiently as they navigate an increasingly complex regulatory environment. As a result, we expect our Legal customers to be focused on productivity solutions to help them manage and deliver legal services efficiently and cost-effectively. As global commerce recovers and grows, we anticipate an increasing need for legal and regulatory solutions that facilitate investment, trade and intellectual property.
To meet our Legal customers’ needs, we continue to invest in new products and services, such as WestlawNext. Through 2010 acquisitions, we established a presence in Brazil and India (Revista dos Tribunais and Pangea3, respectively) and added foundational assets serving in-house counsel (Serengeti and Pangea3) and chief compliance officers in financial institutions (Complinet). Complinet forms the center of a new Governance, Risk and Compliance (GRC) business unit within the Legal segment, which combines our Professional division-wide assets and capabilities in GRC. Our key priorities in 2011 include driving further customer adoption of WestlawNext, supporting growth in the legal industries of rapidly developing economies, and developing solutions to make our customers more productive. Over the next few years, we expect gradual operating profit margin improvement in the Legal segment.
Tax & Accounting
|
Year ended December 31,
|
Percentage change:
|
||||||||||||||||||||||||||
|
(millions of U.S. dollars)
|
2010
|
2009
|
Existing
businesses
|
Acquired
businesses
|
Constant currency
|
Foreign
currency
|
Total
|
||||||||||||||||||||
|
Revenues
|
1,079 | 1,006 | 3% | 4% | 7% | - | 7% | ||||||||||||||||||||
|
Segment operating profit
|
216 | 214 | 1% | ||||||||||||||||||||||||
|
Segment operating profit margin
|
20.0 | % | 21.3 | % | (130) bp | ||||||||||||||||||||||
bp = basis points.
Revenues increased on a constant currency basis reflecting the following:
|
|
●
|
Workflow & Service Solutions, which comprised two-thirds of segment revenues, increased 12% from continued demand for our Income Tax software products and Global Tax solutions as well as contributions from acquired businesses, primarily Sabrix (a provider of transaction tax management software and related services) and Abacus (a provider of corporate income tax and work flow solutions), which we acquired in the fourth quarter of 2009; and
|
|
|
●
|
Business Compliance & Knowledge Solutions revenues decreased 1% as a 9% increase in revenues from Checkpoint was offset by a decline in print, which comprised approximately 9% of segment revenues.
|
Segment operating profit increased due to the benefits of scale from higher revenues, partially offset by dilution from acquisitions and amortization associated with product investment, which also caused a decrease in the related margin.
2011 Outlook
We expect continued regulatory complexity and stringency as governments raise tax revenues to reduce budget deficits and drive information initiatives in the post-financial crisis environment. The impact of globalization and converging accounting standards, including the increased adoption of International Financial Reporting Standards (IFRS), also create compliance challenges for companies and accounting firms. Additionally, we expect continued demand from companies for lower cost solutions that produce tax savings as companies strive for profitability. These trends will continue to create demand for our Tax & Accounting segment’s information, software and workflow solutions.
Tax & Accounting’s key priorities in 2011 include driving further adoption of our ONESOURCE global tax workstation, which we launched in the fourth quarter of 2010, leveraging the scale of our technology platforms through consolidation and expanding the segment’s global presence.
Thomson Reuters Annual Report 2010
35
Healthcare & Science
|
Year ended December 31,
|
Percentage change:
|
||||||||||||||||||||||
|
(millions of U.S. dollars)
|
2010
|
2009
|
Existing
businesses
|
Acquired
businesses
|
Constant currency
|
Foreign
currency
|
Total
|
||||||||||||||||
|
Revenues from ongoing businesses
|
881 | 829 | 4% | 3% | 7% | (1%) | 6% | ||||||||||||||||
|
Revenues from disposals (1)
|
1 | 49 | n/m | n/m | n/m | n/m | n/m | ||||||||||||||||
|
Revenues
|
882 | 878 | n/m | n/m | n/m | n/m | - | ||||||||||||||||
|
Year ended December 31,
|
|||||||||||
|
(millions of U.S. dollars)
|
2010
|
2009
|
Change
|
||||||||
|
Operating profit from ongoing businesses
|
198 | 185 | 7% | ||||||||
|
Operating loss from disposals (1)
|
- | (13 | ) | ||||||||
|
Segment operating profit
|
198 | 172 | 15% | ||||||||
|
Operating profit margin for ongoing businesses
|
22.5 | % | 22.3 | % | 20bp | ||||||
|
Segment operating profit margin
|
22.4 | % | 19.6 | % | 280bp | ||||||
| (1) | Comprised of PLM (a drug information provider in Latin America) sold in 2010 as well as PDR (Physicians’ Desk Reference) and Liquent both sold in 2009. |
n/m = not meaningful; bp = basis points.
Revenues from ongoing businesses increased on a constant currency basis driven by our Payer and Scientific & Scholarly Research (SSR) businesses. Payer revenues increased 13% reflecting continued strong demand for our healthcare spending analytics solutions, particularly in the Employer, Health Plan and Pharmaceutical customer groups. SSR revenues increased 10% driven by demand for our core information offering Web of Science / Thomson Reuters Web of Knowledge and contributions from Discovery Logic, which we acquired on December 31, 2009.
Segment operating profit from ongoing businesses and the related margin increased driven by cost management and favorable revenue mix.
2011 Outlook
The U.S. market environment has been characterized by an aging population, growth in chronic conditions and complexity of healthcare options, which have driven high healthcare costs. In 2010, healthcare reform legislation was enacted in the U.S. with the intent to make healthcare more affordable and readily available. The legislation will impact government, corporations (payers as well as the pharmaceutical industry), providers and individuals. We also believe government spending in developed markets will be under pressure in 2011 as many jurisdictions cope with budget deficits. The recent U.S. legislation and these macroeconomic trends create demand by corporations, governments and hospitals for decision support solutions to manage costs by eliminating waste, abuse and fraud, while achieving quality and efficiency. We believe that the trend across our customer groups toward using metrics to simplify complex decision-making will also sustain demand in the areas of scholarly research and drug discovery.
In 2011, Healthcare & Science plans to continue to shift its offerings from referential data to critical data and analytics which help inform decision making and enable organizations to achieve improved outcomes. The segment’s most important priority will be driving customer adoption of Advantage Suite 5.0, our healthcare spending analytics offering, which we launched in the fourth quarter of 2010. Healthcare & Science also remains well positioned to benefit from continued economic growth in rapidly developing economies due to the global presence of our science business.
Thomson Reuters Annual Report 2010
36
Markets division
The following tables summarize our Markets division revenues and operating profit for 2010 and 2009:
|
Year ended December 31,
|
Percentage change:
|
||||||||||||||||||||||
|
(millions of U.S. dollars)
|
2010
|
2009
|
Existing
businesses
|
Acquired
businesses
|
Constant currency
|
Foreign
currency
|
Total
|
||||||||||||||||
|
Revenues
|
|||||||||||||||||||||||
|
Sales & Trading (1)
|
3,547 | 3,637 | (3%) | 1% | (2%) | - | (2%) | ||||||||||||||||
|
Investment & Advisory (1)
|
2,214 | 2,290 | (5%) | 1% | (4%) | 1% | (3%) | ||||||||||||||||
|
Enterprise (1)
|
1,356 | 1,277 | 7% | - | 7% | (1%) | 6 | ||||||||||||||||
|
Media (1)
|
324 | 331 | (3%) | 1% | (2%) | - | (2%) | ||||||||||||||||
|
Revenues
|
7,441 | 7,535 | (2%) | 1% | (1%) | - | (1%) | ||||||||||||||||
|
Year ended December 31,
|
|||||||||||
|
(millions of U.S. dollars)
|
2010
|
2009
|
Change
|
||||||||
|
Segment operating profit
|
1,337 | 1,453 | (8%) | ||||||||
|
Segment operating profit margin
|
18.0 | % | 19.3 | % | (130) bp | ||||||
|
(1)
|
Results for 2009 have been reclassified to reflect the 2010 presentation.
|
bp = basis points.
Revenues decreased on a constant currency basis. Despite an overall decline, the trend improved throughout the year, with increases of 2% and 1% in the fourth and third quarters of 2010, compared to earlier declines of 3% and 4% in the second and first quarters of the year, respectively. Strong subscription revenue growth from Markets’ Enterprise business, higher transaction-related revenues and contributions from acquired businesses, were more than offset by the impact of cancellations from 2009, expected reductions associated with the integration and lower recoveries revenues.
A discussion of Markets’ revenue by type follows:
|
|
●
|
Subscription revenues decreased 2% primarily due to the impact from negative net sales in 2009. Given the subscription nature of our business, the impact of customer cancellations on our reported revenues tends to lag the economic cycle. Our 2010 results also reflect the initial benefits of new product offerings including Thomson Reuters Elektron, our new low-latency data distribution platform and Thomson Reuters Eikon, our new desktop platform.
|
|
|
●
|
Recoveries revenues (low-margin revenues that we collect and largely pass-through to a third party provider, such as stock exchange fees) declined 6% due to cost control among users and certain exchanges moving toward direct billing of their customers.
|
|
|
●
|
Transaction revenues increased 5%, driven by Tradeweb and strong foreign exchange volumes, in part benefiting from Eurozone credit concerns in 2010.
|
|
|
●
|
Outright revenues, which represented a small portion of Markets revenues, increased 10%, led by our Enterprise and Investment & Advisory business units.
|
Geographically, revenues increased in Asia, but were more than offset by decreases in the Americas and EMEA.
An analysis of revenues from the Markets division’s businesses, on a constant currency basis, is as follows:
|
|
●
|
Sales & Trading revenues decreased 2% due to a decline in subscription revenues attributable to desktop cancellations in 2009 and strategic decisions to shut down certain legacy products (in Exchange Traded Instruments and Fixed Income) as part of our integration and lower recoveries revenues. These decreases more than offset an 8% increase in Transaction-related revenues attributable to higher volumes in foreign exchange as well as in fixed income as part of our Tradeweb business. Commodities & Energy, increased 8% (5% from the Point Carbon acquisition). While revenues decreased for the year as a whole, the second half of 2010 improved as third quarter revenues were comparable to the prior year period and fourth quarter revenues increased 2%.
|
|
|
●
|
Investment & Advisory revenues decreased 4% reflecting the effects from 2009 negative net sales, cost cutting by our customers and retiring legacy products. Lower revenues from the Investment Management business more than offset higher revenues from Corporate customers. Investment Management revenues decreased 10% due to cancellations from buy-side customers seeking to cut costs or exit the business entirely and competitive pressures. Corporate revenues increased 6% principally due to contributions from Hugin, a provider of regulatory and news distribution services, which we acquired in 2009. Revenues from Wealth Management and Investment Banking were largely unchanged.
|
Thomson Reuters Annual Report 2010
37
|
|
●
|
Enterprise revenues increased 7% driven by continued customer demand for Thomson Reuters Elektron, our innovative new low-latency data distribution platform. Revenues increased across most product groups, including Enterprise Real Time Solutions, which increased 9% driven by strong performance in specialist data, consolidated feeds and tick history, Platform (formerly referred to as Information Management Systems) which increased 11% and Content, which increased 10%, driven by demand for pricing and reference data. Revenues from Omgeo, our trade processing joint venture with The Depository Trade & Clearing Corporation, declined due to lower equity volumes. Revenues from Trade & Risk Management solutions increased 5%, as customers committed on previously delayed buying decisions in the second half of the year.
|
|
|
●
|
Media revenues decreased 2% due to 2009 cancellations and lower syndication and health business. Revenues from the advertising-based consumer business increased 8% driven by growth in U.S. online advertising. As we exited 2010, both the Agency and Consumer businesses began to improve. Reuters America for Publishers was launched in December 2010, helping to position the Reuters News Agency as a one-stop shop for content and services. Reflecting signs of economic recovery, the new sales environment improved throughout the year, resulting in revenue increases in the fourth quarter of 2010.
|
Segment operating profit and the related margin decreased due to the decline in revenues and investment in new product initiatives which more than offset integration savings and tight cost controls.
2011 Outlook
To date, the recovery in the financial services industry has been slower than expected. While the business environment for 2011 is expected to continue to improve, it is unlikely to reach pre-financial crisis levels. Many of our customers in the Markets division, particularly the larger banks, continue to be under significant profit pressure, thereby restricting their ability to spend on information services.
External Environment
In 2011, global growth is expected to be led by rapidly developing economies in Asia and Latin America, while developed markets are expected to grow more slowly. We expect government economic stimulus will continue to wind down in 2011 and this may pose a risk to overall economic activity. In financial services, layoffs in the U.S. have stabilized, and net positive hiring is expected in the U.S. and Europe in 2011. In Asia, high growth in headcount is expected to continue. While unexpected regulatory outcomes could reverse these anticipated trends, we believe most financial institutions are generally better positioned now than a year ago. Trading volumes were down from their previous highs in 2010. However, volumes in the Treasury markets are growing strongly and foreign exchange is becoming an increasingly important investment asset class. Although assets under management by our customers have increased, investment manager headcounts have not increased proportionately and we expect continued competitive pressure in this sector. In media, publishers are shifting to multi-platform, multi-media offerings, driving demand for linked video, picture and print content, leading to an increase in global advertising spend.
Regulatory Environment
Regulatory changes, led by the U.S. and Europe, will have a major impact on the financial services industry in 2011. A high degree of uncertainty about the impact of these changes exists as many rules have yet to be adopted, notably those under Dodd-Frank and the Basel III Accord. These regulatory changes present potential opportunities and risks for our business. Among the potential opportunities are an increase in activity associated with our transaction platforms, higher demand for our pricing data and analytics, and greater opportunities to provide tools required for compliance. Proposed reforms which may present risks for our business include restrictions on our customers’ trading activities, higher capital requirements and other rules which may raise the costs of doing business for our customers.
Priorities
In 2011, Markets will continue to focus on its multi-year transformation initiative to move from a product company to an integrated platform company and to simplify the business to take advantage of scale. Specifically, Markets will continue to drive the adoption of Thomson Reuters Eikon, our next generation product delivery platform, by our Sales & Trading customers and we expect to begin offering Thomson Reuters Eikon to our Investment & Advisory customers by the end of the year. To further leverage the scalability of the Markets division’s business, we expect to invest in data centers, data distribution and network communications as well as business systems and processes directed at improving our customers’ experience with us. Markets also expects to pursue targeted market opportunities and to expand in rapidly developing economies. We believe Markets is well positioned to benefit from increases in transaction volumes resulting from sustained economic recovery and market activity. In particular, we expect Thomson Reuters Elektron, our recently launched data distribution platform, will address customers’ increasing requirements for electronic trading. Recent acquisitions, including Point Carbon, in the growing carbon trading market and Tradeweb are also expected to contribute to revenue growth. See the section entitled “Tradeweb” for additional information.
Thomson Reuters Annual Report 2010
38
Corporate & Other
The following table details our Corporate & Other expenses for the periods presented:
|
Year ended December 31,
|
||||||||||||
|
(millions of U.S. dollars)
|
2010
|
2009
|
$ Change
|
|||||||||
|
Core corporate expenses
|
249 | 253 | (4 | ) | ||||||||
|
Integration programs expenses
|
463 | 506 | (43 | ) | ||||||||
|
Fair value adjustments
|
117 | 170 | (53 | ) | ||||||||
|
Total
|
829 | 929 | (100 | ) | ||||||||
Corporate & Other expenses decreased reflecting:
|
|
●
|
Lower core corporate expenses from tight cost management and savings resulting from our integration programs;
|
|
|
●
|
Lower integration programs expenses; we began our initiatives in 2008 and we expect to complete the programs by the end of 2011. See “Integration Programs” for additional information.
|
|
|
●
|
Lower fair value adjustments primarily reflecting changes in foreign currency exchange rates between the U.S. dollar and Euro; the U.S. dollar and British pound sterling; the U.S. dollar and other currencies; and the Euro and other currencies. These adjustments are non-cash accounting adjustments from the revaluation of embedded foreign exchange derivatives within certain customer and vendor contracts due to fluctuations in foreign exchange rates.
|
Review of Fourth Quarter Results
Consolidated Results
The following table provides a summary of our results for the fourth quarter of 2010 and 2009:
|
Three months ended
December 31,
|
||||||||||||
|
(millions of U.S. dollars, except per share amounts)
|
2010
|
2009
|
Change
|
|||||||||
|
IFRS Financial Measures
|
||||||||||||
|
Revenues
|
3,458 | 3,357 | 3 | % | ||||||||
|
Operating profit
|
307 | 346 | (11 | %) | ||||||||
|
Diluted earnings per share
|
$ | 0.27 | $ | 0.21 | 29 | % | ||||||
|
Non-IFRS Financial Measures
|
||||||||||||
|
Revenues from ongoing businesses
|
3,458 | 3,349 | 3 | % | ||||||||
|
Underlying operating profit
|
669 | 661 | 1 | % | ||||||||
|
Underlying operating profit margin
|
19.3 | % | 19.7 | % | (40 | ) bp | ||||||
|
Adjusted earnings per share from continuing operations
|
$ | 0.43 | $ | 0.44 | (2 | %) | ||||||
bp = basis points.
Foreign currency effects. With respect to the average foreign exchange rates we use to report our results, the U.S. dollar strengthened against the Euro and to a lesser degree against the British pound sterling in the fourth quarter of 2010 compared to 2009. Given our currency mix of revenues and expenses around the world, these fluctuations had a negative impact on our revenues and underlying operating profit margin.
Thomson Reuters Annual Report 2010
39
Revenues. The following table provides information on our revenues for the fourth quarter of 2010 and 2009:
|
Three months ended
December 31,
|
Percentage change:
|
||||||||||||||||||||||
|
(millions of U.S. dollars)
|
2010
|
2009
|
Existing
businesses
|
Acquired
businesses
|
Constant currency
|
Foreign
currency
|
Total
|
||||||||||||||||
|
Legal (1)
|
971 | 903 | 3% | 5% | 8% | - | 8% | ||||||||||||||||
|
Tax & Accounting (1)
|
330 | 311 | 4% | 2% | 6% | - | 6% | ||||||||||||||||
|
Healthcare & Science
|
239 | 224 | 5% | 3% | 8% | (1%) | 7% | ||||||||||||||||
|
Professional division
|
1,540 | 1,438 | 4% | 3% | 7% | - | 7% | ||||||||||||||||
|
Sales & Trading (2)
|
900 | 896 | - | 2% | 2% | (2%) | - | ||||||||||||||||
|
Investment & Advisory (2)
|
551 | 572 | (3%) | - | (3%) | (1%) | (4%) | ||||||||||||||||
|
Enterprise (2)
|
384 | 361 | 8% | - | 8% | (2%) | 6% | ||||||||||||||||
|
Media (2)
|
86 | 85 | 2% | - | 2% | (1%) | 1% | ||||||||||||||||
|
Markets division
|
1,921 | 1,914 | 1% | 1% | 2% | (2%) | - | ||||||||||||||||
|
Eliminations
|
(3 | ) | (3 | ) | n/m | n/m | n/m | n/m | n/m | ||||||||||||||
|
Revenues from ongoing businesses
|
3,458 | 3,349 | 2% | 2% | 4% | (1%) | 3% | ||||||||||||||||
|
Revenues from disposals (3)
|
- | 8 | n/m | n/m | n/m | n/m | n/m | ||||||||||||||||
|
Revenues
|
3,458 | 3,357 | n/m | n/m | n/m | n/m | 3% | ||||||||||||||||
|
(1)
|
The Professional division’s BARBRI legal education business and the Scandinavian Legal and Tax & Accounting businesses, which were announced for sale in 2011, are included in their respective segment results. See “Subsequent Events”.
|
|
(2)
|
Results for 2009 have been reclassified to reflect the 2010 presentation.
|
|
(3)
|
Comprised of businesses formerly within our Healthcare & Science segment, PLM sold in 2010 and Liquent sold in 2009.
|
n/m - not meaningful.
Revenues from ongoing businesses increased in the fourth quarter of 2010, on a constant currency basis, reflecting contributions across our Professional division, the Enterprise unit of Markets division and newly acquired businesses.
Professional division
Professional division revenues from ongoing businesses increased on a constant currency basis, driven by our subscription Legal products, Tax & Accounting and Healthcare & Science businesses, as well as acquisitions.
Further details about the performance of each of our Professional division businesses were as follows:
|
|
●
|
Legal revenues increased due to contributions from subscription-related products, which increased 9%, led by 17% growth in FindLaw and 14% growth in international businesses. Non-subscription revenues increased 4%, reflecting higher revenues from stronger sales at our Elite law firm automation and Intellectual Property (trademark search) businesses. Westlaw ancillary revenues declined as customers continued to tightly control spending above their base subscription contracts. Revenues from print products increased 7% due to favorable timing as the prior year period was affected by acceleration of product shipments into the first half of 2009. Increases also reflected contributions from acquired businesses.
|
|
|
●
|
Tax & Accounting revenues increased due to contributions from our Workflow & Service Solutions business, which grew 10%, led by growth in income tax software products, property tax services and acquisitions (Sabrix and Abacus). Business Compliance & Knowledge revenues were comparable to the prior-year period, as Checkpoint growth of 10% was offset by a decline in print, which comprised 10% of Tax & Accounting’s fourth-quarter revenues.
|
|
|
●
|
Healthcare & Science revenues increased from continued demand for our healthcare spending analytics in the Payer business, which increased revenues double digits. Revenues from our SSR business increased 4%, driven by core information offerings and acquisitions.
|
Thomson Reuters Annual Report 2010
40
Segment operating profit and margin. The following table provides information about segment operating profit and the related margin for our Professional division businesses in the fourth quarter of 2010 and 2009:
|
Three months ended
December 31,
|
||||||||||
|
(millions of U.S. dollars)
|
2010
|
2009
|
Change
|
Commentary
|
||||||
|
Legal(1)
|
255 | 268 | (5%) | Decrease in operating profit and margin as dilution from acquisitions and investments in growth initiatives more than offset savings from efficiency initiatives. | ||||||
|
Margin
|
26.3% | 29.7% | (340) bp | |||||||
|
Tax & Accounting (1)
|
110 | 101 | 9% |
Increase in operating profit and margin driven by benefits of scale from higher revenues. Approximately 50% of segment operating profit realized in 4th quarter due to seasonal product releases.
|
||||||
|
Margin
|
33.3% | 32.5% | 80bp |
|
Healthcare & Science
|
56 | 52 | 8% |
Increase in operating profit and margin driven by benefits of scale from higher revenues in Payer and SSR as well as a timing benefit as the prior year period reflected one-time costs.
|
||||||
|
Margin
|
23.4% | 23.2% | 20bp |
|
Professional – Ongoing businesses
|
421 | 421 | - |
Decrease in operating profit margin as continued product investment, dilution from acquisitions and timing of expenses more than offset cost savings from efficiency initiatives.
|
||||||
|
Margin
|
27.3% | 29.3% | (200) bp |
|
Disposals (2)
|
- | (1) | ||||||||
|
Professional - Total
|
421 | 420 | - | |||||||
|
Margin
|
27.3% | 29.0% | (170) bp |
|
(1)
|
The Professional division’s BARBRI legal education business and the Scandinavian Legal and Tax & Accounting businesses, which were announced for sale in 2011, are included in their respective segment results. See “Subsequent Events”.
|
|
(2)
|
Comprised of businesses formerly within our Healthcare & Science segment, PLM sold in 2010 and Liquent sold in 2009.
|
bp = basis points.
Markets division
Markets division revenues increased 2% in the fourth quarter of 2010, on a constant currency basis, reflecting the best increase since the fourth quarter of 2008. Subscription revenues, which represented 74% of Markets division revenues, increased 1%. Transaction and outright revenues increased 13% and 5%, respectively. These increases more than offset a 3% decline in low-margin recoveries revenues. By geography, revenues increased across all major regions of the world, except in the Americas. Asia increased 5%, EMEA increased 2% and the Americas declined 1%.
Further details about the performance of each of our Markets division businesses in the fourth quarter were as follows:
|
|
●
|
Sales & Trading revenues increased driven by transaction revenues, which increased 27% as a result of higher volumes at Tradeweb and Commodities & Energy, which increased 12% (including contributions from our 2010 acquisition of Point Carbon). Fixed Income revenues increased 7%. Treasury revenues increased 1% as the impact of 2009 negative net sales largely offset higher revenues from growing foreign currency volumes. Our decision to shut down certain legacy products as part of our integration contributed to a 5% decrease in revenues from Exchange Traded Instruments.
|
|
|
●
|
Investment & Advisory revenues declined as a 2% increase in revenues from Wealth Management and Corporate was more than offset by lower revenues from Investment Management, which has been affected by competitive pressures, although there has been an improvement in sales since September 2010.
|
|
|
|
|
●
|
Enterprise revenues increased driven by continued demand for its data distribution platform, Thomson Reuters Elektron, which now has eleven hosting centers around the world. Enterprise Real Time Solutions revenues increased 12%, as customers continued to invest in low-latency data feeds and hosting solutions. Risk Management revenues increased 3%, aided by outright sales. Platform (formerly Information Management Systems) revenues increased 9%, driven by sales of recurring products and outright revenues. Content revenues increased 11%, driven by growth in pricing and reference data. Revenues from Omgeo increased 1%, returning to growth as a result of stronger equity volumes.
|
|
|
●
|
Media revenues increased driven by new sales. Despite tight customer budgets, News Agency revenues increased 1%, driven by recurring TV revenues. Consumer revenues increased 11%, driven by higher online advertising sales across all global properties.
|
Thomson Reuters Annual Report 2010
41
Segment operating profit and margin. The following table provides information about segment operating profit and the related margin for our Markets division:
|
Three months ended
December 31,
|
||||||||||||
|
(millions of U.S. dollars)
|
2010
|
2009
|
Change
|
Commentary
|
||||||||
|
Segment operating profit
|
336 | 323 | 4% |
Increase in operating profit and margin driven by higher revenues and benefits of integration programs, partially offset by investment in new product platforms and other strategic initiatives.
|
||||||||
|
Margin
|
17.5 | % | 16.9 | % | 60bp | |||||||
bp = basis points.
Corporate & Other
The following table details our Corporate & Other expenses in the fourth quarter of 2010 compared to 2009:
|
Three months ended December 31,
|
|||||||||||
|
(millions of U.S. dollars)
|
2010
|
2009
|
$ Change
|
||||||||
|
Core corporate expenses
|
88 | 83 | 5 | ||||||||
|
Integration programs expenses
|
173 | 163 | 10 | ||||||||
|
Fair value adjustments
|
42 | 35 | 7 | ||||||||
|
Total
|
303 | 281 | 22 | ||||||||
Corporate costs increased primarily from higher integration program expenses and timing of core corporate expenses. Fair value adjustments are non-cash. See our “Corporate & Other” full-year results of operations discussion for additional information about fair value adjustments.
Operating profit. The following table provides a reconciliation of our operating profit to underlying operating profit for the fourth quarters of 2010 and 2009:
|
Three months ended
December 31,
|
|||||||||||
|
(millions of U.S. dollars)
|
2010
|
2009
|
Change
|
||||||||
|
Operating profit
|
307 | 346 | (11%) | ||||||||
|
Adjustments:
|
|||||||||||
|
Integration programs expenses
|
173 | 163 | |||||||||
|
Amortization of other identifiable intangible assets
|
146 | 132 | |||||||||
|
Fair value adjustments
|
42 | 35 | |||||||||
|
Disposals
|
- | 1 | |||||||||
|
Other operating (gains) losses, net
|
1 | (16 | ) | ||||||||
|
Underlying operating profit
|
669 | 661 | 1% | ||||||||
|
Underlying operating profit margin
|
19.3 | % | 19.7 | % | (40) bp | ||||||
bp = basis points.
Operating profit decreased as the benefits from higher revenues in Professional and integration-related savings in Markets were more than offset by investment in new products launched in 2010, acquisition dilution, higher integration costs, higher amortization of other identifiable intangible assets and an unfavorable impact from foreign currency. The prior-year period also benefitted from other operating gains.
Underlying operating profit increased slightly as higher revenues in Professional and integration-related savings in Markets were largely offset by investments in new products launched in 2010, acquisition dilution and an unfavorable impact from foreign currency. The corresponding margin decreased reflecting these same factors.
Thomson Reuters Annual Report 2010
42
Operating expenses. The following table provides information about our operating expenses for the fourth quarters of 2010 and 2009:
|
Three months ended December 31,
|
|||||||||||
|
(millions of U.S. dollars)
|
2010
|
2009
|
Change
|
||||||||
|
Operating expenses
|
2,739 | 2,612 | 5% | ||||||||
|
Remove:
|
|||||||||||
|
Fair value adjustments
|
(42 | ) | (35 | ) | |||||||
|
Operating expenses, excluding fair value adjustments
|
2,697 | 2,577 | 5% | ||||||||
Operating expenses (excluding fair value adjustments) increased reflecting investments in growth initiatives and costs associated with acquisitions. Integration-related savings and tight cost controls partially mitigated these increases. Staff costs, which include salaries, bonuses, commissions, benefits, payroll taxes and share-based compensation, represented approximately 51% of our expenses in 2010 compared to 50% in 2009, and increased by 6% in 2010 for the same reasons noted above. Operating expenses in 2010 also reflected lower costs associated with a decrease in recoveries revenues in our Markets division.
Depreciation and amortization.
|
Three months ended
December 31,
|
|||||||||||
|
(millions of U.S. dollars)
|
2010
|
2009
|
Change
|
||||||||
|
Depreciation
|
110 | 139 | (21%) | ||||||||
|
Amortization of computer software
|
155 | 144 | 8% | ||||||||
|
Amortization of other identifiable intangible assets
|
146 | 132 | 11% | ||||||||
|
|
●
|
Depreciation. The decrease reflected that certain assets acquired in the Reuters acquisition are now fully depreciated, the impact of which more than offset increases from new capital expenditures.
|
|
|
●
|
Amortization of computer software. The increase reflected higher amortization attributable to the recent product launches such as Thomson Reuters Eikon and WestlawNext, investments in growth initiatives and assets of newly-acquired businesses.
|
|
|
●
|
Amortization of other identifiable intangible assets. The increase was due to amortization from newly-acquired assets, which more than offset decreases from the completion of amortization for certain identifiable intangible assets acquired in previous years.
|
Other operating gains, net. In the fourth quarter of 2010, acquisition-related expenses offset an $18 million gain from re-measuring our pre-acquisition investment in Tradeweb New Markets (TWNM). See “Tradeweb” for additional information.
In the fourth quarter of 2009, other operating gains, net, were primarily comprised of a $30 million gain on the sale of a wholly owned subsidiary to a company affiliated with Woodbridge, partially offset by losses associated with businesses we have sold. See “Related Party Transactions” for additional information.
Net interest expense. Net interest expense was $96 million and $88 million in the fourth quarter of 2010 and 2009, respectively. Net interest expense was higher in the fourth quarter of 2010 as the prior year period reflected a reversal of interest associated with uncertain tax positions.
Other finance income (costs). Other finance income was $8 million in the fourth quarter of 2010 compared to other finance costs of $178 million in the prior year period. The prior year period principally reflected foreign currency losses associated with the settlement of certain intercompany loans.
Other non-operating charge. In 2009, in conjunction with the recognition of tax losses which had been acquired in a business combination, we recorded a $59 million reduction to goodwill. We recorded the reduction to goodwill as an expense below operating profit because the accounting adjustment was not reflective of our core operating results. There was no cash impact from this adjustment.
Tax benefit. Tax benefit for the fourth quarter of 2010 and 2009 reflected the mix of taxing jurisdictions in which pre-tax profits and losses were recognized. Because the geographical mix of pre-tax profits and losses in interim periods distorts the reported effective tax rate, tax expense in interim periods is not necessarily indicative of tax expense for the full year.
Thomson Reuters Annual Report 2010
43
In 2010, the income tax benefit included $47 million of discrete tax benefits relating primarily to the reversals of uncertain tax contingencies established through acquisition accounting and reductions in deferred tax liabilities resulting from lower jurisdictional tax rates. In 2009, the income tax benefit included a net benefit of approximately $170 million which primarily related to an intercompany sale of an asset. There was no cash impact from this transaction as the sale was completed in a tax free manner. The net benefit represented the release of a $496 million deferred tax liability that was no longer required as a result of the sale, offset by the utilization of a deferred tax asset of $326 million.
Net earnings and earnings per share. Net earnings were $225 million and $182 million for the fourth quarter of 2010 and 2009, respectively. Diluted earnings per share were $0.27 and $0.21 for the fourth quarter of 2010 and 2009, respectively. Increased earnings and earnings per share primarily reflected significantly higher other finance costs and a non-operating charge in 2009, partially offset by lower operating profit and a lower tax benefit in the current period.
Adjusted earnings and adjusted earnings per share from continuing operations. The following table provides information on our adjusted earnings calculation for the fourth quarters of 2010 and 2009:
|
Three months ended
December 31,
|
|||||||||||
|
(millions of U.S. dollars, except per share amounts)
|
2010
|
2009
|
Change
|
||||||||
|
Earnings attributable to common shareholders
|
224 | 177 | 27% | ||||||||
|
Adjustments:
|
|||||||||||
|
Disposals
|
- | 1 | |||||||||
|
Fair value adjustments
|
42 | 35 | |||||||||
|
Other operating losses (gains), net
|
1 | (16 | ) | ||||||||
|
Other finance (income) costs
|
(8 | ) | 178 | ||||||||
|
Other non-operating charge
|
- | 59 | |||||||||
|
Share of post-tax earnings in equity method investees
|
(2 | ) | (5 | ) | |||||||
|
Tax on above
|
(13 | ) | (8 | ) | |||||||
|
Interim period effective tax rate normalization
|
22 | (9 | ) | ||||||||
|
Amortization of other identifiable intangible assets
|
146 | 132 | |||||||||
|
Discrete tax items
|
(47 | ) | (175 | ) | |||||||
|
Discontinued operations
|
- | (6 | ) | ||||||||
|
Dividends declared on preference shares
|
(1 | ) | - | ||||||||
|
Adjusted earnings from continuing operations
|
364 | 363 | - | ||||||||
|
Adjusted earnings per share from continuing operations
|
$ | 0.43 | $ | 0.44 | (2%) | ||||||
Adjusted earnings from continuing operations was essentially unchanged. Higher integration costs and interest expense offset the increase in underlying operating profit.
Cash flow. Net cash provided by operating activities was $1,083 million in the fourth quarter of 2010 compared to $896 million in the prior year period. The increase was due to favorable timing of working capital and tax payments.
Return on Invested Capital
We measure our return on invested capital, or ROIC, to assess, over the long term, our ability to create value for our shareholders. Our goal is to increase this return over the long term by using our capital to invest in areas with high returns and realizing operating efficiencies to further enhance our profitability. We continued to invest in our business, as economic recovery remained uneven in our markets, but we were not able to increase our operating profit margin. As a result, our ROIC declined to 6.0% in 2010 from 6.8% in 2009. In 2011, we will drive customer adoption of our recently launched product platforms, continue to execute on efficiency initiatives to improve operating profit margin and focus our acquisition strategy on high-growth software and service businesses. Additionally, a period of heavy investment relating to the launch of our new products is coming to an end, as will investments in our Reuters integration program. We believe that all of these objectives will lead to an increase in ROIC over the long term. See Appendix C for our calculation of ROIC.
Thomson Reuters Annual Report 2010
44
LIQUIDITY AND CAPITAL RESOURCES
We follow a disciplined capital management strategy that seeks to:
|
|
●
|
Focus on free cash flow and ensure that cash generated is balanced between reinvestment in the business and returns to shareholders; and
|
|
|
●
|
Maintain a strong balance sheet, strong credit ratings and ample financial flexibility to support the execution of our business strategies.
|
At December 31, 2010, we had a strong liquidity position with:
|
|
●
|
Approximately $0.9 billion of cash on hand;
|
|
|
|
|
●
|
Access to a committed, but unused $2.5 billion syndicated credit facility; and
|
|
|
|
|
●
|
The ability to access global capital markets, as evidenced by our issuance of approximately $1.2 billion principal amount of debt securities in 2010.
|
We expect to continue to generate significant free cash flow in 2011 attributable to our strong business model and diversified customer base. We believe that cash on hand, cash from our operations and available credit facilities will be sufficient to fund our cash dividends, debt service, capital expenditures, acquisitions in the normal course of business and any opportunistic share repurchases.
FINANCIAL POSITION
Our total assets were $35.5 billion at December 31, 2010 (2009: $34.6 billion). Assets from newly acquired businesses and capital expenditures more than offset the effects of depreciation and amortization.
Our total assets by segment as of December 31, 2010 and 2009 were as follows:
|
As at December 31,
|
||||||||
|
(millions of U.S. dollars)
|
2010
|
2009
|
||||||
|
Legal
|
7,400 | 6,820 | ||||||
|
Tax & Accounting
|
1,888 | 1,900 | ||||||
|
Healthcare & Science
|
1,537 | 1,565 | ||||||
|
Professional division
|
10,825 | 10,285 | ||||||
|
Markets division
|
22,511 | 22,010 | ||||||
|
Segment totals
|
33,336 | 32,295 | ||||||
|
Corporate & Other
|
2,195 | 2,278 | ||||||
|
Total assets
|
35,531 | 34,573 | ||||||
Our acquisition activity and strategic product investments were focused on the Markets division and the Legal segment in 2010, leading to increases in their respective segment assets.
Net Debt
The following table presents information related to our net debt as of the dates indicated:
|
As at December 31,
|
||||||||
|
(millions of U.S. dollars)
|
2010
|
2009
|
||||||
|
Current indebtedness
|
645 | 782 | ||||||
|
Long-term indebtedness
|
6,873 | 6,821 | ||||||
|
Total debt
|
7,518 | 7,603 | ||||||
|
Swaps
|
(296 | ) | (137 | ) | ||||
|
Total debt after swaps
|
7,222 | 7,466 | ||||||
|
Remove fair value adjustments for hedges
|
(31 | ) | (26 | ) | ||||
|
Remove transaction costs and discounts included in the carrying value of debt
|
62 | 54 | ||||||
|
Less: cash and cash equivalents
|
(864 | ) | (1,111 | ) | ||||
|
Net debt
|
6,389 | 6,383 | ||||||
Thomson Reuters Annual Report 2010
45
Our net debt position at December 31, 2010 approximates the prior year-end. Total debt after swaps decreased reflecting repayments of debt.
In 2010, we issued approximately $1.2 billion principal amount of debt securities. Using the proceeds from these borrowings and cash on hand, we repaid our 2010 scheduled debt maturities as well as other long-term debt with less favorable interest rates, prior to their scheduled maturity. As a result of these transactions, we extended the average maturity of our debt portfolio to about eight years at an average interest rate (after swaps) under 6%. See “2010 Activity” for additional information.
2010 Activity
The following table outlines notes offered and repaid in 2010:
|
Date
|
Transaction
|
Principal
Amount
(in millions)
|
|
Notes offered
|
||
|
March 2010
|
5.85% notes due 2040
|
US$500
|
|
September 2010
|
4.35% notes due 2020
|
C$750
|
|
Notes repaid
|
||
|
March/April 2010
|
6.20% notes due 2012 (1)
|
US$700
|
|
November 2010
|
4.625% notes due 2010
|
€500
|
|
(1)
|
These notes were redeemed prior to their scheduled maturity.
|
We funded the early redemption of notes in March / April 2010 and the November 2010 debt maturity with the net proceeds from note offerings in March and September 2010, respectively, and with available cash resources. Upon completion of the September 2010 offering, we entered into fixed-to-fixed cross-currency swap agreements which converted the notes to $731 million principal amount at an interest rate of 3.91%.
2009 Activity
The following table outlines notes offered and repaid in 2009:
|
Date
|
Transaction
|
Principal
Amount
(in millions)
|
|
Notes offered
|
||
|
March 2009
|
6.00% notes due 2016
|
C$750
|
|
September 2009
|
4.70% notes due 2019
|
US$500
|
|
Notes repaid
|
||
|
June 2009
|
4.50% notes due 2009
|
C$250
|
|
August 2009
|
4.25% notes due 2009
|
US$200
|
|
October 2009
|
7.74% notes due 2010 (1)
|
US$75
|
|
October 2009
|
4.75% notes due 2010 (1)
|
US$250
|
|
October 2009
|
6.85% notes due 2011 (1)
|
C$400
|
|
December 2009
|
4.35% notes due 2009
|
C$300
|
|
(1)
|
These notes were redeemed prior to their scheduled maturity.
|
We funded our 2009 debt maturities and the early redemption of notes in October 2009 with the net proceeds from our offering of notes in March and September 2009, respectively, and with available cash resources. Upon completion of the March 2009 offering, we entered into fixed-to-fixed cross-currency swap agreements which converted the notes to $610 million principal amount at an interest rate of 6.915%.
Thomson Reuters Annual Report 2010
46
Total Equity
The following table shows the changes in our total equity for 2010 and 2009:
|
(millions of U.S. dollars)
|
2010
|
2009
|
||||||
|
Balance at January 1,
|
19,335 | 18,488 | ||||||
|
Net earnings
|
933 | 867 | ||||||
|
Share issuances
|
120 | 79 | ||||||
|
Effect of share-based compensation plans on paid in capital (1)
|
(13 | ) | 64 | |||||
|
Dividends declared on common shares
|
(966 | ) | (927 | ) | ||||
|
Dividends declared on preference shares
|
(3 | ) | (2 | ) | ||||
|
Unrecognized net (loss) on cash flow hedges
|
(10 | ) | (54 | ) | ||||
|
Change in foreign currency translation adjustment
|
1 | 851 | ||||||
|
Net actuarial losses on defined benefit pension plans, net of tax
|
(108 | ) | (4 | ) | ||||
|
Change in ownership interest of subsidiary (2)
|
416 | - | ||||||
|
Distributions to non-controlling interests
|
(30 | ) | (27 | ) | ||||
|
Balance at December 31,
|
19,675 | 19,335 | ||||||
|
(1)
|
Includes impact from revision in accounting for withholding taxes on share based compensation. See note 1 of our 2010 annual financial statements.
|
|
(2)
|
See “Tradeweb” for additional information.
|
Additional Information on Liquidity
The maturity dates for our long-term debt are well balanced with no significant concentration in any one year. See “Off-Balance Sheet Arrangements, Commitments and Contractual Obligations” for a schedule of debt maturities by year from 2011 to 2015 and in the aggregate for periods thereafter.
At December 31, 2010, the carrying amounts of our total current liabilities exceeded the carrying amounts of our total current assets principally because current liabilities include deferred revenue. Deferred revenue does not represent a cash obligation, but rather an obligation to perform services or deliver products in the future. The costs to fulfill these obligations are included in our operating expenses.
We monitor the financial strength of financial institutions with which we have banking and other commercial relationships, including those that hold our cash and cash equivalents as well as those which are counterparties to derivative financial instruments and other arrangements.
Guarantees
We guarantee certain obligations of our subsidiaries, including borrowings by our subsidiaries under our revolving credit facility. Under our revolving credit facility discussed below, we must maintain a ratio of net debt as of the last day of each fiscal quarter to EBITDA as defined in the credit facility agreement (earnings before interest, income taxes, depreciation and amortization and other modifications described in the credit facility agreement) for the last four quarters ended of not more than 4.5:1. We were in compliance with this covenant at December 31, 2010.
We operated under a dual listed company (DLC) structure between April 2008 and September 2009 with two parent companies (Thomson Reuters Corporation and Thomson Reuters PLC) that cross guaranteed each other’s obligations. In March 2010, we completed an intercompany reorganization that included the amalgamation of Thomson Reuters Corporation and Thomson Reuters UK Limited (formerly known as Thomson Reuters PLC). As a result of the amalgamation, Thomson Reuters Corporation inherited all of the liabilities of Thomson Reuters UK Limited, including those under its cross guarantee in favor of Thomson Reuters Corporation.
RATINGS OF DEBT SECURITIES
Our access to financing depends on, among other things, suitable market conditions and the maintenance of suitable long-term credit ratings. Our credit ratings may be adversely affected by various factors, including increased debt levels, decreased earnings, declines in customer demand, increased competition, a further deterioration in general economic and business conditions and adverse publicity. Any downgrades in our credit ratings may impede our access to the debt markets or raise our borrowing rates.
Thomson Reuters Annual Report 2010
47
The following table sets forth the credit ratings that we have received from rating agencies in respect of our outstanding securities as of March 1, 2011:
|
Moody’s
|
Standard & Poor’s
|
DBRS Limited
|
Fitch
|
|
|
Long-term debt
|
Baa1
|
A-
|
A (low)
|
A-
|
|
Commercial paper
|
-
|
A-1 (low)
|
R-1 (low)
|
F2
|
|
Trend/Outlook
|
Stable
|
Stable
|
Stable
|
Stable
|
These credit ratings are not recommendations to purchase, hold or sell securities and do not address the market price or suitability of a specific security for a particular investor. Credit ratings may not reflect the potential impact of all risks on the value of securities. We cannot assure you that our credit ratings will not be lowered in the future or that rating agencies will not issue adverse commentaries regarding our securities.
SHARE REPURCHASE PROGRAM
Under our current Normal Course Issuer Bid share repurchase facility, we may repurchase up to 15 million common shares (representing less than 2% of the total outstanding shares) in open market transactions on the TSX or the NYSE through May 12, 2011.
Although we have not repurchased any shares since 2008, we may buy back shares from time to time as part of our capital management strategy. Decisions regarding any future repurchases will be based on market conditions, share price and other factors including opportunities to invest capital for growth.
We may elect to suspend or discontinue our share repurchases at any time, in accordance with applicable laws. Shares that are repurchased are cancelled. From time to time when we do not possess material nonpublic information about ourselves or our securities, we may enter into a pre-defined plan with our broker to allow for the repurchase of shares at times when we ordinarily would not be active in the market due to our own internal trading blackout periods, insider trading rules or otherwise. Any such plans entered into with our broker will be adopted in accordance with applicable Canadian securities laws and the requirements of Rule 10b5-1 under the U.S. Securities Exchange Act of 1934, as amended.
DIVIDEND REINVESTMENT PLAN (DRIP)
Registered holders of common shares may participate in the DRIP, under which cash dividends are automatically reinvested in new common shares. Common shares are valued at the weighted-average price at which the shares traded on the TSX during the five trading days immediately preceding the record date for the dividend.
CASH FLOW
Our principal sources of liquidity are cash on hand, cash provided by our operations, borrowings under our revolving credit facility and our commercial paper program, as well as the issuance of public debt. At December 31, 2010, we had no borrowings outstanding under our $2.5 billion revolving credit facility, nor did we have any commercial paper outstanding. Our principal uses of cash have been for debt servicing costs, debt repayments, dividend payments, capital expenditures and acquisitions. Additionally, we have occasionally used cash to repurchase outstanding shares in open market transactions, though we have not repurchased any shares since 2008.
Summary of Statement of Cash Flow
The following table presents summary cash flow information for 2010 and 2009:
|
Year ended December 31,
|
||||||||||||
|
(millions of U.S. dollars)
|
2010
|
2009
|
$ Change
|
|||||||||
|
Cash provided by operating activities
|
2,655 | 2,666 | (11 | ) | ||||||||
|
Cash used in investing activities
|
(1,675 | ) | (1,365 | ) | (310 | ) | ||||||
|
Cash used in financing activities
|
(1,219 | ) | (1,051 | ) | (168 | ) | ||||||
|
Translation adjustments on cash and cash equivalents
|
(8 | ) | 20 | (28 | ) | |||||||
|
(Decrease) increase in cash and cash equivalents
|
(247 | ) | 270 | (517 | ) | |||||||
|
Cash and cash equivalents at beginning of period
|
1,111 | 841 | 270 | |||||||||
|
Cash and cash equivalents at end of period
|
864 | 1,111 | (247 | ) | ||||||||
Thomson Reuters Annual Report 2010
48
Key highlights:
|
|
●
|
Our business model is highly cash-generative. In both 2010 and 2009, cash provided by operating activities was $2.7 billion;
|
|
|
●
|
We made significant investments in acquisitions and technology-related capital expenditures to broaden our business and improve our capabilities;
|
|
|
●
|
Our ability to access capital markets enabled us to refinance debt securities at attractive rates; and
|
|
|
●
|
Our shareholder returns included $0.9 billion of dividends in both 2010 and 2009.
|
Operating activities. In 2010, cash provided by operating activities was largely unchanged, as lower operating profit was offset by working capital benefits including a one-time benefit of approximately $100 million.
Investing activities. The increase in cash used by investing activities in 2010 reflected higher acquisition spending as capital expenditures were comparable in both years.
The following charts provide additional metrics regarding our investing activities for 2010 and 2009:
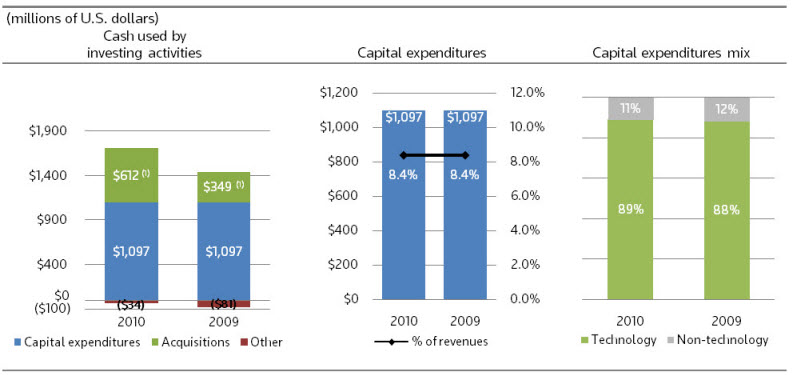
(1) Net of cash acquired of $250 million and $19 million in 2010 and 2009, respectively.
Acquisition spending reflected our continued focus on broadening our product and service offerings and execution of our globalization strategy. In 2010, we acquired foundational assets in higher-growth segments and expanded our global footprint in rapidly developing economies, including Brazil and India. For more information, see the “Acquisitions and Dispositions” section of this management’s discussion and analysis.
Our capital expenditures in both 2010 and 2009 related primarily to the development of strategic product platforms and infrastructure technology. Within our Markets division, we invested in Thomson Reuters Eikon, our flagship financial information platform and Thomson Reuters Elektron, our low latency infrastructure for electronic trading and data distribution. Within our Professional division, we invested in WestlawNext, the ONESOURCE global tax workstation, and Advantage Suite 5.0. We also made significant investments across our businesses in data center consolidation and virtualization.
The majority of our capital expenditures are technology-related investments. We make significant investments in technology because it is essential to providing information solutions to our customers and because we intend to maintain the competitive advantage we believe we have in this area. Our technology expenditures include spending on computer hardware and software for product platforms, delivery systems and infrastructure.
Financing activities. Our financing activities were comprised of the following:
|
|
●
|
In 2010, financing activities principally reflected our issuance of approximately $1.2 billion of debt securities in March 2010 and September 2010, the repayment of approximately $1.5 billion of debt securities and dividends paid. See the section entitled “2010 Activity” for additional information.
|
|
|
●
|
In 2009, financing activities principally reflected our issuance of approximately $1.1 billion of debt securities in March 2009 and September 2009, the repayment of approximately $1.2 billion of debt securities and dividends paid. See the section entitled “2009 Activity” for additional information.
|
Thomson Reuters Annual Report 2010
49
The following table sets forth dividend information for 2010 and 2009:
|
Year ended December 31,
|
||||||||
|
(millions of U.S. dollars)
|
2010
|
2009
|
||||||
|
Dividends declared
|
966 | 927 | ||||||
|
Dividends reinvested in shares
|
(68 | ) | (22 | ) | ||||
|
Dividends paid
|
898 | 905 | ||||||
In February 2010, our board of directors approved a $0.04 per share increase in the annualized dividend to $1.16 per common share. In February 2011, the annualized dividend was increased to $1.24 per common share. See “Subsequent Events” for additional information.
The increase in dividends reinvested in shares in 2010 reflects higher reinvestment by Woodbridge in the fourth quarter of 2010.
Free cash flow and underlying free cash flow. The following table sets forth calculations of our free cash flow and underlying free cash flow for 2010 and 2009:
|
Year ended December 31,
|
||||||||
|
(millions of U.S. dollars)
|
2010
|
2009
|
||||||
|
Net cash provided by operating activities
|
2,655 | 2,666 | ||||||
|
Capital expenditures, less proceeds from disposals
|
(1,097 | ) | (1,097 | ) | ||||
|
Other investing activities
|
8 | 3 | ||||||
|
Dividends paid on preference shares
|
(3 | ) | (2 | ) | ||||
|
Free cash flow
|
1,563 | 1,570 | ||||||
|
Integration programs costs (1)
|
450 | 488 | ||||||
|
Underlying free cash flow
|
2,013 | 2,058 | ||||||
|
(1)
|
Free cash flow includes one-time cash costs associated with our integration programs. We remove these costs to derive our underlying free cash flow.
|
The strength of our highly-cash generative business model was reflected in our ability to generate $2.0 billion of underlying free cash flow in 2010, slightly below 2009. In 2010, lower operating profit offset strong working capital management, including a one-time working capital benefit of approximately $100 million.
Credit facility. We have a $2.5 billion unsecured revolving credit facility that currently expires in August 2012. We may request an extension of the maturity date under certain circumstances for up to two additional one-year periods, which the applicable lenders may accept or decline in their sole discretion. We may also request an increase, subject to approval by applicable lenders, in the amount of the lenders’ commitments up to a maximum amount of $3.0 billion. As of December 31, 2010, we had no borrowings under this facility.
We can utilize this facility to provide liquidity in connection with our commercial paper program and for general corporate purposes. Based on our current credit rating, the cost of borrowing under the agreement is priced at LIBOR plus 19 basis points (or plus 24 basis points on all borrowings when line utilization exceeds 50%). If our long-term debt rating was downgraded by Moody’s or Standard & Poor’s, our facility fee and borrowing costs may increase, although availability would be unaffected. Conversely, an upgrade in our ratings may reduce our credit facility fees and borrowing costs. The facility contains certain customary affirmative and negative covenants, each with customary exceptions. The financial covenant related to this facility is described in the “Financial Position” subsection above. We monitor the lenders that are party to our facility and believe they continue to be able to lend to us.
Debt shelf prospectus. Our debt shelf prospectus recently expired in January 2011. We expect to file a new debt shelf prospectus in the first quarter of 2011.
FINANCIAL RISK MANAGEMENT
Our operations are diverse and global in nature. Accordingly, we are exposed to a variety of financial risks, which include market risk (primarily currency risk and interest rate risk), credit risk and liquidity risk. Our risk management approach is to minimize the potential adverse effects from these risks on our financial performance. Financial risk management is carried out by our centralized corporate treasury group under strict guidelines and process controls. Our treasury group identifies, evaluates and hedges financial risks. Relative to financial risks within the businesses, our corporate treasury group designs a risk management approach in close cooperation with each of our operating segments. The overall approach is under the oversight of our Chief Financial Officer. The section entitled “Financial Risk Management” in note 19 of our 2010 annual financial statements provides a detailed discussion of the material financial risks we are exposed to and our approach to mitigating the potential adverse effects on our financial performance.
Thomson Reuters Annual Report 2010
50
Our global operations expose us to foreign exchange risk related to cash flows in currencies other than the U.S. dollar. As our operations outside the U.S. continue to expand, we expect this trend to continue. In particular, we have exposure to the British pound sterling and the Euro. In 2010, we implemented a program to mitigate our foreign exchange exposure by entering into a series of foreign exchange contracts to purchase or sell certain currencies in the future at fixed amounts. Because these instruments have not been designated as hedges for accounting purposes, changes in the fair value of these contracts are recognized through the income statement with no offsetting impact. In 2010, there was no material impact to our income statement from such fair value changes. The fair value of outstanding contracts at December 31, 2010 was a net liability of $9 million, which we reported within “Other financial assets–current” and “Other financial liabilities-current” in our statement of financial position. We may enter into additional derivative financial instruments in the future in order to mitigate our foreign exchange risk. See note 19 of our 2010 annual financial statements for additional information.
The following table outlines the currency profile of our revenues and expenses for 2010:
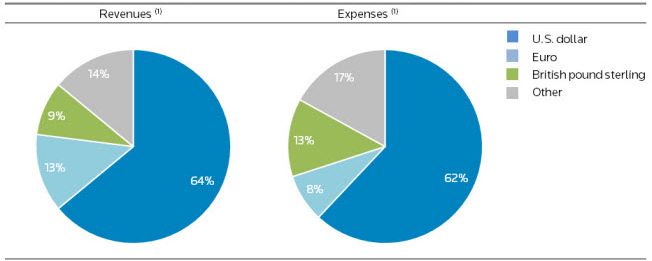
|
(1)
|
Revenues from ongoing businesses. Expenses associated with underlying operating profit. Based on average rates of U.S. dollar / British pound sterling = 1.546 and U.S. dollar / Euro = 1.327.
|
OFF-BALANCE SHEET ARRANGEMENTS, COMMITMENTS AND CONTRACTUAL OBLIGATIONS
The following table summarizes our long-term debt and off-balance sheet contractual obligations:
|
(millions of U.S. dollars)
|
2011
|
2012
|
2013
|
2014
|
2015
|
Thereafter
|
Total
|
|||||||||||||||||||||
|
Long-term debt (1)
|
598 | - | 1,000 | 1,387 | 588 | 3,887 | 7,460 | |||||||||||||||||||||
|
Interest payable (1)
|
404 | 384 | 360 | 315 | 235 | 1,563 | 3,261 | |||||||||||||||||||||
|
Debt-related hedges outflows (2)
|
727 | 127 | 129 | 620 | 685 | 1,487 | 3,775 | |||||||||||||||||||||
|
Debt-related hedges inflows (2)
|
(759 | ) | (141 | ) | (140 | ) | (725 | ) | (684 | ) | (1,648 | ) | (4,097 | ) | ||||||||||||||
|
Operating lease payments
|
329 | 274 | 233 | 186 | 145 | 425 | 1,592 | |||||||||||||||||||||
|
Unconditional purchase obligations
|
693 | 543 | 446 | 365 | 255 | 137 | 2,439 | |||||||||||||||||||||
|
Pension contributions (3)
|
50 | - | - | - | - | - | 50 | |||||||||||||||||||||
|
Total
|
2,042 | 1,187 | 2,028 | 2,148 | 1,224 | 5,851 | 14,480 | |||||||||||||||||||||
|
(1)
|
Represents our contractual principal and interest payments. Future cash flows have been calculated using forward foreign exchange rates.
|
|
(2)
|
Our non-U.S. dollar-denominated debt has been hedged into U.S. dollars. Debt-related hedges outflows represent our projected payments to counterparties. Where future interest cash flows are not fixed, amounts have been calculated using forward interest rates. Debt-related hedges inflows represent our projected cash receipts from counterparties. These future cash flows have been calculated using forward foreign exchange rates. We present our projected inflows along with outflows in order to reflect the net cash flow we anticipate from our debt-related hedging instruments in order to satisfy principal and interest payments to our long-term debt securities holders.
|
|
(3)
|
Represents expected contributions to our pension plans in accordance with normal funding policy. These amounts do not include voluntary contributions we may elect to make from time to time.
|
Thomson Reuters Annual Report 2010
51
We provide further information about our obligations below:
|
|
●
|
Operating leases - We enter into operating leases in the ordinary course of business, primarily for real property and equipment. Lease payments represent scheduled, contractual obligations. With certain leases, we guarantee a portion of any residual value loss incurred by the lessors to dispose of the assets, or to restore a property to a specified condition after completion of the lease period. The liability associated with these restorations is recorded within “Provisions and other non-current liabilities” on our statement of financial position.
|
|
|
●
|
Subsidiary guarantees - For certain real property leases, banking arrangements and commercial contracts, we guarantee the obligations of some of our subsidiaries. We also guarantee borrowings by our subsidiaries under our credit agreement.
|
|
|
●
|
Unconditional purchase obligations - We have various obligations for materials, supplies and services incidental to the ordinary conduct of business.
|
|
|
●
|
Pension obligations – We sponsor defined benefit plans that provide pension and other post-employment benefits to covered employees. As of December 31, 2010, the fair value of plan assets for our funded plans was 94% of the plan obligations. In 2010, we made contributions of $87 million (2009: $86 million) to all defined benefit plans including special contributions of $12 million to the Reuters Supplementary Pension Plan (SPS) following discussion with plan trustees. In 2009, we made special contributions of $4 million and $7 million to the Reuters Pension Fund and SPS, respectively.
|
In 2011, we expect to contribute approximately $77 million to all our defined benefit plans, of which $50 million relates to the normal funding policy of our funded plans, and the remainder relates to claims arising under unfunded plans. From time to time, we may elect to make voluntary contributions in order to improve the funded status of the plans. Relative to certain plans, the trustees have the right to call for special valuations, which could result in an unexpected contribution. No such valuation has been called for as of the date of this management’s discussion and analysis. Because of the ability of the trustees to call for interim valuations for certain plans, as well as market driven changes we cannot predict, we could be required to make contributions in the future that differ significantly from our estimates.
|
|
●
|
Acquisition and disposition contingencies - We have obligations to pay additional consideration for prior acquisitions, typically based upon performance measures contractually agreed at the time of purchase. In certain disposition agreements, we guarantee indemnification obligations of our subsidiary that sold the business or assets. We believe, based upon current facts and circumstances, that additional payments in connection with these transactions would not have a material impact on our financial statements.
|
Other than as described above, we do not engage in off-balance sheet financing arrangements. In particular, we do not have any interests in unconsolidated special-purpose or structured finance entities.
TRADEWEB
In January 2008, we formed a partnership with a consortium of global securities dealers (the Consortium) to further expand Tradeweb, our over-the-counter, multi-asset class, online marketplace that is within the Markets division. Tradeweb was structured as two separate entities, Tradeweb Markets (TWM) and Tradeweb New Markets (TWNM), in which we had ownership interests of approximately 85% and 20%, respectively, with the remaining interests owned by the Consortium. In November 2010, in order to better position the businesses for long-term growth opportunities, the two entities completed a transaction to form a single Tradeweb entity (Tradeweb). Upon completion of the transaction, we own the majority of the equity interests of Tradeweb and the Consortium holds a non-controlling interest.
The transaction was accomplished through the exchange of equity interests and the receipt of $30 million in cash consideration. If Tradeweb achieves certain performance milestones in 2011 and 2012, the former owners of TWNM will receive additional equity interests in Tradeweb that would increase the proportion of the Consortium’s non-controlling equity interests in Tradeweb.
The transaction was accounted for as an acquisition of TWNM by TWM. We re-measured our pre-acquisition investment in TWNM of 20%, resulting in a pre-tax gain of $18 million. The gain was reported within “Other operating (losses) gains, net” in the income statement as we acquired a controlling ownership interest in TWNM as a result of the transaction.
The exchange of equity interests resulted in an increase to non-controlling interests of $291 million and an increase in retained earnings of $125 million.
|
|
●
|
The portion of the change in the non-controlling interest arising from the acquisition of TWNM was measured at fair value as of the date of the transaction applying the income approach, market approach and comparable transaction approach;
|
Thomson Reuters Annual Report 2010
52
|
|
●
|
The change in our ownership interest in TWM did not result in a change in control and therefore was accounted for as an equity transaction measured at historical book value and recorded in retained earnings; and
|
|
|
●
|
The contingent consideration was measured at fair value at the date of the transaction, a portion of which was recorded to retained earnings and a portion recorded as a financial liability.
|
As of the completion of the transaction, we fully consolidate the combined entity in our financial statements.
CONTINGENCIES
Lawsuits and Legal Claims
In November 2009, the European Commission initiated an investigation relating to our use of our company’s Reuters Instrument Codes (RIC symbols). RIC symbols help financial professionals retrieve news and information on financial instruments (such as prices and other data on stocks, bonds, currencies and commodities). We are fully cooperating with the investigation. We do not believe that we have engaged in any anti-competitive activity related to RIC symbols.
In addition to the matter described above, we have engaged in various legal proceedings and claims that have arisen in the ordinary course of business. The outcome of all of the proceedings and claims against us, including the matter described above, is subject to future resolution, including the uncertainties of litigation. Based on information currently known to us and after consultation with outside legal counsel, management believes that the probable ultimate resolution of any such proceedings and claims, individually or in the aggregate, will not have a material adverse effect on our financial condition, taken as a whole.
Uncertain Tax Positions
We are subject to taxation in numerous jurisdictions. There are many transactions and calculations during the course of business for which the ultimate tax determination is uncertain. We maintain provisions for uncertain tax positions that we believe appropriately reflect our risk. These provisions are made using the best estimate of the amount expected to be paid based on a qualitative assessment of all relevant factors. We review the adequacy of these provisions at the end of the reporting period. In April 2008, upon the completion of a routine tax audit for the years 2003 to 2005, the Internal Revenue Service notified us that it would challenge certain positions taken on our tax returns. The IRS subsequently challenged similar positions on our tax returns for 2006 and 2007. The IRS has since informed us that it will no longer challenge these positions for the years 2003 to 2007, but that it will challenge other positions for the years 2006 and 2007. It is possible that at some future date, liabilities in excess of our provisions could result from audits by, or litigation with, the IRS or other relevant taxing authorities. Management believes that such additional liabilities would not have a material adverse impact on our financial condition taken as a whole.
DLC UNIFICATION
We previously operated under a dual listed company (DLC) structure, with shareholders in two publicly listed entities, Thomson Reuters Corporation and Thomson Reuters PLC. The DLC structure was established to facilitate the acquisition of Reuters in 2008. Given changes to our shareholder base since the Reuters acquisition, our shareholders and a U.K. court approved a proposal for unification of the DLC. Unification was completed in September 2009. Unification was a change to our corporate structure that did not impact our global businesses, operations, strategy, financial position or employees.
Under unification, we exchanged each outstanding Thomson Reuters PLC ordinary share for one Thomson Reuters Corporation common share and each outstanding Thomson Reuters PLC American Depositary Share (ADS) was exchanged for six Thomson Reuters Corporation common shares. The former holders of Thomson Reuters PLC ordinary shares and existing holders of Thomson Reuters Corporation common shares, including Woodbridge, continued to have the same ownership interest in Thomson Reuters after unification as they did immediately prior to unification. Thomson Reuters PLC was renamed Thomson Reuters UK Limited and became a wholly owned subsidiary of our company.
Thomson Reuters Annual Report 2010
53
OUTLOOK
The information in this section is forward-looking and should be read in conjunction with the section below entitled “Cautionary Note Concerning Factors That May Affect Future Results”.
The following table sets forth our current 2011 outlook, the material assumptions related to our outlook and the material risk factors that may cause actual performance to differ materially from our current expectations.
Our 2011 outlook excludes the Professional division’s BARBRI legal education business and Scandinavian Legal and Tax & Accounting businesses, both of which are expected to be sold in the first half of 2011, and the impact of changes in foreign currency exchange rates.
|
2011 Outlook
|
Material assumptions
|
Material risk factors
|
||||
|
Revenues expected to grow mid-single digits
|
● New products gain momentum, driving positive net sales and our markets continue to recover
● Positive global GDP growth, led by rapidly developing economies
● Continued increase in the number of professionals around the world and their demand for high quality information and services
● Successful execution of ongoing product release programs, globalization strategy and other growth initiatives
|
● Uneven economic recovery across the markets we serve may result in reduced spending levels by our customers
● Demand for our products and services could be reduced by changes in customer buying patterns or competitive pressures
● Implementation of regulatory reform, including Dodd-Frank legislation and similar financial services laws around the world may limit business opportunities for our customers, lowering their demand for our products and services
● As government stimulus programs unwind, global economic recovery slows or reverts to recession
|
||||
|
Adjusted EBITDA margin to increase by at least 300 basis points
|
● Revenues expected to grow mid-single digits in 2011
● Business mix within our Professional division continues to shift to an increasing percentage of software and solutions which have lower initial margins compared to print and non-subscription based businesses
Revenues from higher-margin print and non-subscription-based businesses remain comparable to 2010 levels
● Integration programs completed at an in-period cost of $200 million
● Realization of expected benefits and savings from our integration program and efficiency initiatives
|
● See risk factors above related to revenue outlook
● Revenues from higher margin print and non-subscription based businesses may be lower than expected
● The costs of required investments exceed expectations or actual returns are below expectations
● See the risk factors below related to integration program savings
|
||||
|
Underlying operating profit margin expected to increase by at least 100 basis points, after absorbing a 70 basis point impact from higher depreciation and amortization related to prior years’ investments in recently launched products
|
● Adjusted EBITDA margin to increase by at least 300 basis points in 2011
|
● See risk factors above related to Adjusted EBITDA margin
● 2011 capital expenditures may be higher than currently expected, resulting in higher in-period depreciation and amortization of computer software charges
|
Thomson Reuters Annual Report 2010
54
|
Outlook
|
Material assumptions
|
Material risk factors
|
|||
|
Free cash flow expected to increase 20% to 25%
|
● Revenues expected to grow mid-single digits in 2011
● Adjusted EBITDA margin to increase by at least 300 basis points in 2011
● Capital expenditures decline as a percentage of revenues to between 7.5% to 8.0% of revenues in 2011
|
● See risk factors above related to revenue outlook and adjusted EBITDA margin
● Higher capital expenditures than currently expected
|
|||
|
Achieve integration program run-rate savings of $1.7 billion at an in-period cost of $200 million
|
● We will have the ability to execute our integration plan as currently anticipated
|
● Benefits may not be achieved to the extent, or within the time period, currently expected
● The timing and amount of costs incurred in 2011 may vary from current expectations
|
Additionally, in 2011, we expect that: our depreciation and amortization of computer software will represent 8% to 8.5% of revenues; interest expense to be $400 to $425 million, assuming no significant change in our level of indebtedness; Core corporate expenses increase to approximately $290 million, reflecting higher healthcare costs; and our effective tax rate (as a percentage of post-amortization earnings) to be in a range of 20% to 22%, assuming no changes in current tax laws or treaties to which we are subject.
Thomson Reuters Annual Report 2010
55
RELATED PARTY TRANSACTIONS
As of March 1, 2011, Woodbridge beneficially owned approximately 55% of our shares.
TRANSACTIONS WITH WOODBRIDGE
From time to time, in the normal course of business, Woodbridge and certain of its affiliates purchase some of our product and service offerings. These transactions are negotiated at arm’s length on standard terms, including price, and are not significant to our results of operations or financial condition either individually or in the aggregate.
In December 2009, we sold a Canadian wholly owned subsidiary to a company affiliated with Woodbridge for approximately $30 million. The subsidiary had no business operations, but had accumulated losses that management did not expect to utilize against future taxable income prior to their expiry. As such, no tax benefit for the losses had been recognized in the financial statements. Under Canadian law, certain losses may only be transferred to related companies, such as those affiliated with Woodbridge. A gain of $30 million was recorded within “Other operating (losses) gains, net” within the consolidated income statement. In connection with this transaction, an independent accounting firm retained by the board of directors’ Corporate Governance Committee provided an opinion based on its experience as professional business valuators that the sale price was not less than the fair market value of the losses and represented a reasonable negotiated price between us and the purchaser. After receiving the recommendation of the Corporate Governance Committee, the board of directors approved the transaction. Directors who were not considered independent because of their positions with Woodbridge refrained from deliberating and voting on the matter at both the committee and board meetings.
In the normal course of business, certain of our subsidiaries charge a Woodbridge owned company fees for various administrative services. In 2010, the total amount charged to Woodbridge for these services was approximately $126,000 (2009 - $360,000).
We purchase property and casualty insurance from third party insurers and retain the first $500,000 of each and every claim under the programs via our captive insurance subsidiary. Woodbridge is included in these programs and pays us a premium commensurate with its exposures. Premiums relating to 2010 were $67,000 (2009 - $73,000), which would approximate the premium charged by a third party insurer for such coverage.
At December 31, 2010 and 2009, the amounts receivable from Woodbridge in respect of the above transactions were negligible.
We maintained an agreement with Woodbridge until April 17, 2008 (the closing date of the Reuters acquisition) under which Woodbridge agreed to indemnify up to $100 million of liabilities incurred either by our current and former directors and officers or by our company in providing indemnification to these individuals on substantially the same terms and conditions as would apply under an arm’s length, commercial arrangement. We were required to pay Woodbridge an annual fee of $750,000, which was less than the premium that would have been paid for commercial insurance. In 2008, we replaced this agreement with a conventional insurance agreement. We are entitled to seek indemnification from Woodbridge for any claims arising from events prior to April 17, 2008, so long as the claims are made before April 17, 2014.
TRANSACTIONS WITH AFFILIATES AND JOINT VENTURES
We enter into transactions with our investments in affiliates and joint ventures. These transactions involve providing or receiving services and are entered into in the normal course of business and on an arm’s length basis.
We and The Depository Trust & Clearing Corporation (DTCC) each have a 50% interest in Omgeo, a provider of trade management services. Omgeo pays us for use of a facility and technology and other services. For 2010, these services were valued at approximately $9 million (2009 - $10 million). At December 31, 2010 and 2009, the amount receivable from Omgeo was approximately $2 million.
We and Shin Nippon Hoki Shuppan K.K. each own 50% of Westlaw Japan K.K., a provider of legal information and solutions to the Japanese legal market. We provide the joint venture with technology and other services, which were valued at approximately $2 million for 2010 (2009 - $3 million). The amounts receivable relating to technology and other services were negligible at December 31, 2010 and 2009.
Prior to the Tradeweb transaction in November 2010, as described in the section entitled “Tradeweb”, TWM provided services, including use of its trading platform and various back office functions, to TWMN. In 2010, we recognized revenues of $16 million related to these services (2009 - $18 million). At December 31, 2009, the amount receivable from TWNM was $3 million.
Thomson Reuters Annual Report 2010
56
In connection with the 2008 acquisition of Reuters, we assumed a lease agreement with 3XSQ Associates, an entity now owned by Thomson Reuters and Rudin Times Square Associates LLC that was formed to build and operate the 3 Times Square property and building in New York, New York that now serves as our corporate headquarters. We follow the equity method of accounting for our investment in 3XSQ Associates. The lease provides us with over 690,000 square feet of office space until 2021 and includes provisions to terminate portions early and various renewal options. In 2010, our costs related to 3XSQ Associates were approximately $38 million for rent, taxes and other expenses (2009 - $37 million). At December 31, 2010 and 2009, the amounts payable to 3XSQ Associates were negligible.
OTHER TRANSACTIONS
In February 2010, we acquired Super Lawyers from an entity controlled by Vance Opperman, one of our directors, for approximately $15 million. The acquisition helps expand FindLaw’s product offerings. Mr. Opperman’s son was the CEO of the acquired business and agreed to stay on with the business through a transition period which concluded in the third quarter of 2010. The board of directors reviewed and approved the transaction. Mr. Opperman refrained from deliberating and voting on the matter.
In October 2010, we acquired Serengeti, a provider of electronic billing and matter management systems for corporate legal departments. As a result of a prior investment in a venture lending firm, Peter Thomson, one of the our directors, may have the right to receive 10% of the purchase consideration paid by our company. Mr. Thomson did not participate in negotiations related to the acquisition of Serengeti and refrained from deliberating and voting on the acquisition.
SUBSEQUENT EVENTS
2011 DIVIDENDS
In February 2011, our board of directors approved a $0.08 per share increase in the annual dividend to $1.24 per common share. The next quarterly dividend of $0.31 per share is payable on March 15, 2011 to shareholders of record as of February 22, 2011.
PLANNED DIVESTITURES
In February 2011, we announced our intention to sell the following Professional division businesses which are no longer fundamental to our strategy:
|
Business
|
Segment
|
Description
|
||
|
BARBRI
|
Legal
|
A provider of bar exam preparatory workshops, courses, software, lectures and other tools in the U.S.
|
||
|
Scandinavian legal, tax and accounting businesses
|
Legal and
Tax & Accounting
|
A provider of legal and regulatory products and services in Denmark and Sweden.
|
These sales are expected to be completed in the first half of 2011, and will not qualify for discontinued operations classification. As our business outlook for 2011 is based on our expectations excluding these businesses, we have provided selected historical financial information in Appendix B which also excludes these businesses.
TERMINATION OF VENDOR AGREEMENT
In the first quarter of 2011, we reached agreement with a vendor to terminate an information technology (IT) outsourcing agreement, which had been signed by Reuters prior to the acquisition of that business. We and the vendor mutually terminated the agreement as the vendor was unable to provide certain services. Following a transition period with the vendor, we plan to fold these technology support services into our existing in-house operations.
We expect to record total charges of approximately $100 million relating to this termination in 2011, of which the majority will be non-cash. These charges represent payments that were made to the vendor in prior periods for which we will receive no future value, net of amounts that are payable by us and the vendor in connection with the termination and subsequent transition. The charges do not affect our financial outlook for 2011.
Thomson Reuters Annual Report 2010
57
CHANGES IN ACCOUNTING POLICIES
PRONOUNCEMENTS EFFECTIVE PROSPECTIVELY FROM JANUARY 1, 2010
IAS 21, The Effects of Changes in Foreign Exchange Rates
Effective January 1, 2010, we adopted an amendment to International Accounting Standard (IAS) 21, The Effects of Changes in Foreign Exchange Rates, as a consequential amendment of IAS 27 (2008), Consolidated and Separate Financial Statements. The amendment requires that accumulated foreign exchange differences are reclassified from equity to the income statement upon loss of control, significant influence or joint control of an entity. Additionally, the amendment provides guidance on the reclassification of accumulated foreign exchange differences to the income statement when a partial disposal of an interest in a foreign entity occurs. As a result of this new guidance, we no longer reclassify accumulated foreign exchange differences from equity to the income statement upon settlement of intercompany loan balances when there is no change in our ownership interest in a subsidiary.
IFRS 3 (Revised), Business Combinations
Effective January 1, 2010, we adopted IFRS 3 (Revised), Business Combinations. Most significantly, the revised standard requires:
|
|
●
|
directly attributable transaction costs be expensed rather than included in the acquisition purchase price;
|
|
|
●
|
contingent consideration accounted for as a financial liability be measured at fair value on the acquisition date, with subsequent changes in the fair value recorded through the income statement; and
|
|
|
●
|
that upon gaining control in a step acquisition, an entity re-measures its existing ownership interest to fair value through the income statement.
|
During 2010, we expensed $26 million of directly attributable transaction costs related to various acquisitions and recorded an $18 million gain in connection with gaining control in a step acquisition. See “Tradeweb” for additional information.
RECENT ACCOUNTING PRONOUNCEMENTS
Certain new standards, interpretations, amendments and improvements to existing standards were issued by the IASB or International Financial Reporting Interpretations Committee (IFRIC) that are mandatory for accounting periods beginning January 1, 2011 or later periods. The standards impacted that are applicable to us are as follows:
|
|
●
|
IFRS 3 - Business Combinations;
|
|
|
●
|
IFRS 7 - Financial Instruments: Disclosures;
|
|
|
●
|
IAS 1 - Presentation of Financial Statements;
|
|
|
●
|
IAS 24 - Related Party Disclosures;
|
|
|
●
|
IAS 27 - Consolidated and Separate Financial Statements; and
|
|
|
●
|
IAS 34 - Interim Financial Reporting.
|
We do not anticipate that any of these changes will have a material impact on our results of operations or financial position.
In addition to the above, the IASB has issued IFRS 9 - Financial Instruments (Classification and Measurement), which is mandatory for accounting periods beginning January 1, 2013. We are assessing the impact of IFRS 9 on our results of operations and financial position.
CRITICAL ACCOUNTING ESTIMATES AND JUDGMENTS
The preparation of financial statements requires management to make estimates and judgments about the future. Estimates and judgments are continually evaluated and are based on historical experience and other factors, including expectations of future events that are believed to be reasonable under the circumstances. See Appendix D for additional information on our critical accounting estimates and judgments.
Thomson Reuters Annual Report 2010
58
ADDITIONAL INFORMATION
DEPRECIATION AND AMORTIZATION OF COMPUTER SOFTWARE BY SEGMENT
The following table details the depreciation and amortization of computer software by segment for the three months and year ended December 31, 2010 and 2009, respectively.
|
Three months ended
December 31,
|
Year ended
December 31,
|
|||||||||||||||
|
(millions of U.S. dollars)
|
2010
|
2009
|
2010
|
2009
|
||||||||||||
|
Legal
|
(75 | ) | (68 | ) | (288 | ) | (262 | ) | ||||||||
|
Tax & Accounting
|
(25 | ) | (21 | ) | (96 | ) | (78 | ) | ||||||||
|
Healthcare & Science
|
(15 | ) | (15 | ) | (67 | ) | (67 | ) | ||||||||
|
Professional division
|
(115 | ) | (104 | ) | (451 | ) | (407 | ) | ||||||||
|
Markets division
|
(141 | ) | (170 | ) | (553 | ) | (619 | ) | ||||||||
|
Corporate & Other
|
(9 | ) | (9 | ) | (25 | ) | (27 | ) | ||||||||
|
Ongoing businesses
|
(265 | ) | (283 | ) | (1,029 | ) | (1,053 | ) | ||||||||
|
Disposals
|
- | - | - | (4 | ) | |||||||||||
|
Total
|
(265 | ) | (283 | ) | (1,029 | ) | (1,057 | ) | ||||||||
DISCLOSURE CONTROLS AND PROCEDURES
Our Chief Executive Officer and Chief Financial Officer, after evaluating the effectiveness of our disclosure controls and procedures (as defined in applicable U.S. and Canadian securities law) as of the end of the period covered by this management’s discussion and analysis, have concluded that our disclosure controls and procedures are effective to ensure that all information that we are required to disclose in reports that we file or furnish under the U.S. Securities Exchange Act and applicable Canadian securities law is (i) recorded, processed, summarized and reported within the time periods specified in the rules and forms of the SEC and Canadian securities regulatory authorities and (ii) accumulated and communicated to our management, including our Chief Executive Officer and Chief Financial Officer, to allow timely decisions regarding required disclosure.
INTERNAL CONTROL OVER FINANCIAL REPORTING
In 2010, we continued to execute on the integration programs launched in 2008 as a result of the Reuters acquisition. We expect to complete the integration programs in 2011. These programs include the consolidation of certain business information systems and the modification and centralization of related workflows. Because the Reuters acquisition added to the complexity of our global tax reporting process, we continue to modify and enhance the related internal control processes and procedures.
We have begun the phased implementation of order-to-cash (OTC) applications and related workflow processes in our Markets division. Key elements of the OTC solutions are order management, billing, cash management and collections functionality. Significant progress was made in the third quarter of 2010 with order management functionality implemented in the Americas region of our Markets division, and we continue to modify the design and documentation of the related internal control processes and procedures as the regional phased implementation progresses.
Except as described above, there was no change in our internal control over financial reporting during 2010 that materially affected, or is reasonably likely to materially affect, our internal control over financial reporting.
Our management is responsible for establishing and maintaining adequate internal control over financial reporting to provide reasonable assurance regarding the reliability of financial reporting and the preparation of financial statements for external purposes in accordance with IFRS. Our management assessed the effectiveness of our internal control over financial reporting as of December 31, 2010, and based on that assessment determined that our internal control over financial reporting was effective. See our 2010 annual financial statements for our management’s report on internal control over financial reporting.
Thomson Reuters Annual Report 2010
59
SHARE CAPITAL
As of March 1, 2011, we had outstanding 833,933,270 common shares, 6,000,000 Series II preference shares, 12,220,416 stock options and a total of 8,011,589 time-based restricted share units and performance restricted share units. We have also issued a Thomson Reuters Founders Share which enables Thomson Reuters Founders Share Company to exercise extraordinary voting power to safeguard the Thomson Reuters Trust Principles.
PUBLIC SECURITIES FILINGS AND REGULATORY ANNOUNCEMENTS
You may access other information about our company, including our 2010 annual report (which contains information required in an annual information form) and our other disclosure documents, reports, statements or other information that we file with the Canadian securities regulatory authorities through SEDAR at www.sedar.com and in the United States with the SEC at www.sec.gov.
CAUTIONARY NOTE CONCERNING FACTORS THAT MAY AFFECT FUTURE RESULTS
Certain statements in this management’s discussion and analysis, including, but not limited to statements in the ”Outlook” section and our discussion of outlooks for each division and reportable segment in the ”Results of Operations” section, are forward-looking. These forward-looking statements are based on certain assumptions and reflect our company’s current expectations. As a result, forward-looking statements are subject to a number of risks and uncertainties that could cause actual results or events to differ materially from current expectations. Certain factors that could cause actual results or events to differ materially from current expectations are discussed in the “Outlook“ section above. Additional factors are discussed in the “Risk Factors” section of this annual report and in materials that we from time to time file with, or furnish to, the Canadian securities regulatory authorities and the U.S. Securities and Exchange Commission. There is no assurance that any forward-looking statement will materialize. Our outlook is provided for the purpose of providing information about current expectations for 2011. This information may not be appropriate for other purposes. You are cautioned not to place undue reliance on forward-looking statements, which reflect our expectations only as of the date of this management’s discussion and analysis. Except as may be required by applicable law, we disclaim any obligation to update or revise any forward-looking statements.
Thomson Reuters Annual Report 2010
60
APPENDIX A
NON-IFRS FINANCIAL MEASURES
The following table sets forth our non-IFRS financial measures, including an explanation of why we believe they are useful measures of our performance. Reconciliations for the most directly comparable IFRS measure are reflected in our management’s discussion and analysis.
|
Non-IFRS Financial Measure
|
How We Define It
|
Why We Use It and Why It Is Useful to Investors
|
Most Directly Comparable IFRS Measure/Reconciliation
|
|||
|
Revenues from ongoing businesses
|
Revenues excluding results from disposals, which are defined as businesses sold or held for sale that do not qualify for discontinued operations classification.
|
Provides a measure of our ability to grow our ongoing businesses over the long term.
|
Revenues
|
|||
|
Revenues at constant currency (before currency or revenues excluding the effects of foreign currency)
|
Revenues applying the same foreign currency exchange rates for the current and equivalent prior period. To calculate the foreign currency impact between periods, we convert the current and equivalent prior period’s local currency revenues using the same foreign currency exchange rate.
|
Provides a measure of underlying business trends, without distortion from the effect of foreign currency movements during the period.
Our reporting currency is the U.S. dollar. However, we conduct a significant amount of our activities in currencies other than the U.S. dollar. We manage our operating segments on a constant currency basis, and we manage currency exchange risk at the corporate level.
|
Revenues
|
|||
|
Operating profit from ongoing businesses
|
Operating profit excluding results from disposals, which are defined as businesses sold or held for sale that do not qualify for discontinued operations classification.
|
Provides a measure of our ability to grow our ongoing businesses over the long term.
|
Operating profit
|
|||
|
Underlying operating profit and underlying operating profit margin
|
Operating profit excluding amortization of other identifiable intangible assets, certain impairment charges, fair value adjustments, integration programs expenses, other operating gains and losses and the results of disposals. The related margin is expressed as a percentage of revenues from ongoing businesses.
|
Provides a basis to evaluate operating profitability and performance trends by removing the impact of items which distort the performance of our operations.
|
Operating profit
|
|||
|
Adjusted EBITDA and adjusted EBITDA margin
|
Underlying operating profit excluding depreciation and amortization of computer software from ongoing businesses but including integration programs expenses. The related margin is expressed as a percentage of revenues from ongoing businesses.
|
Provides a measure commonly reported and widely used by investors as an indicator of a company’s operating performance and ability to incur and service debt, and as a valuation metric.
|
Net earnings
|
Thomson Reuters Annual Report 2010
61
|
Non-IFRS Financial Measure
|
How We Define It
|
Why We Use It and Why It Is Useful to Investors
|
Most Directly Comparable IFRS Measure/Reconciliation
|
|||
|
Adjusted earnings and adjusted earnings per share from continuing operations
|
Earnings attributable to common shareholders and per share excluding the pre-tax impacts of amortization of other identifiable intangible assets and the post-tax impacts of fair value adjustments, other operating gains and losses, impairment charges, the results of disposals, other net finance costs or income, our share of post-tax earnings or losses in equity method investees, discontinued operations and other items affecting comparability. We also deduct dividends declared on preference shares. This measure is calculated using diluted weighted average shares.
In interim periods, we also adjust our reported earnings and earnings per share to reflect a normalized effective tax rate. Specifically, the normalized effective rate is computed as the estimated full-year effective tax rate applied to adjusted pre-tax earnings of the interim period. The reported effective tax rate is based on separate annual effective income tax rates for each taxing jurisdiction that are applied to each interim period’s pre-tax income.
|
Provides a more comparable basis to analyze earnings and is also a measure commonly used by shareholders to measure our performance.
Because the geographical mix of pre-tax profits and losses in interim periods distorts the reported effective tax rate within an interim period, we believe that using the expected full-year effective tax rate provides more comparability among interim periods. The adjustment to normalize the effective tax rate reallocates estimated full-year income taxes between interim periods, but has no effect on full year tax expense or on cash taxes paid.
|
Earnings attributable to common shareholders and earnings per share attributable to common shareholders
|
Thomson Reuters Annual Report 2010
62
|
Non-IFRS Financial Measure
|
How We Define It
|
Why We Use It and Why It Is Useful to Investors
|
Most Directly Comparable IFRS Measure/Reconciliation
|
|||
|
Net debt
|
Total indebtedness, including the associated fair value of hedging instruments (swaps) on our debt, but excluding unamortized transaction costs and premiums or discounts associated with our debt, less cash and cash equivalents.
|
Provides a measure of indebtedness in excess of the current cash available to pay down debt.
Given that we hedge some of our debt to reduce risk, we include hedging instruments as we believe it provides a better measure of the total obligation associated with our outstanding debt. However, because we intend to hold our debt and related hedges to maturity, we do not consider certain components of the associated fair value of hedges in our measurements. We reduce gross indebtedness by cash and cash equivalents on the basis that they could be used to pay down debt.
|
Total debt (Current indebtedness plus long-term indebtedness)
|
|||
|
Free cash flow
|
Net cash provided by operating activities less capital expenditures, other investing activities, investing activities of discontinued operations and dividends paid on our preference shares.
|
Helps assess our ability, over the long term, to create value for our shareholders as it represents cash available to repay debt, pay common dividends and fund share repurchases and new acquisitions.
|
Net cash provided by operating activities
|
|||
|
Underlying free cash flow
|
Free cash flow excluding one-time cash costs associated with integration programs.
|
Provides a supplemental measure of our ability, over the long term, to create value for our shareholders because it represents free cash flow generated by our operations excluding certain unusual items.
|
Net cash provided by operating activities
|
|||
|
Return on invested capital (ROIC)
|
Adjusted operating profit after net taxes paid expressed as a percentage of the average adjusted invested capital during the period.
|
Provides a measure of how efficiently we allocate resources to profitable activities and is indicative of our ability to create value for our shareholders.
|
IFRS does not require a measure comparable to ROIC. Please see our calculation of ROIC in Appendix C for a reconciliation of the components in the calculation to the most comparable IFRS measure.
|
Thomson Reuters Annual Report 2010
63
APPENDIX B
SUPPLEMENTAL FINANCIAL INFORMATION:
RESULTS FOR ONGOING BUSINESSES EXCLUDING THE PROFESSIONAL DIVISION’S BARBRI AND SCANDINAVIAN LEGAL AND TAX & ACCOUNTING BUSINESSES
In the first quarter of 2011, we announced our intention to sell our Professional division’s BARBRI legal education business and our Scandinavian Legal and Tax & Accounting businesses, both of which are expected to close by the middle of 2011. The following tables set forth our division and business segment information as well as our non-IFRS financial measures, including reconciliations to the most directly comparable IFRS measure, excluding these planned disposals from ongoing businesses. Our 2011 financial outlook set out in the “Outlook” section of this management’s discussion and analysis excludes these planned disposals.
Refer to Appendix A for additional information on non-IFRS financial measures.
Division and business segment information
|
Three months ended
December 31,
|
Year ended
December 31,
|
|||||||||||||||||||||||||||||
|
(millions of U.S. dollars)
|
Change
|
Change
|
||||||||||||||||||||||||||||
|
2010
|
2009
|
Total
|
Existing
Businesses
|
2010
|
2009
|
Total
|
Existing
Businesses
|
|||||||||||||||||||||||
|
Revenues
|
||||||||||||||||||||||||||||||
|
Legal(1)
|
955 | 888 | 8 | % | 3 | % | 3,526 | 3,425 | 3% | - | ||||||||||||||||||||
|
Tax & Accounting (1)
|
329 | 308 | 7 | % | 4 | % | 1,072 | 997 | 8% | 3% | ||||||||||||||||||||
|
Healthcare & Science
|
239 | 224 | 7 | % | 5 | % | 881 | 829 | 6% | 4% | ||||||||||||||||||||
|
Professional division
|
1,523 | 1,420 | 7 | % | 4 | % | 5,479 | 5,251 | 4% | 1% | ||||||||||||||||||||
|
Sales & Trading (1)
|
900 | 896 | - | - | 3,547 | 3,637 | (2%) | (3%) | ||||||||||||||||||||||
|
Investment & Advisory (1)
|
551 | 572 | (4 | %) | (3 | %) | 2,214 | 2,290 | (3%) | (5%) | ||||||||||||||||||||
|
Enterprise (1)
|
384 | 361 | 6 | % | 8 | % | 1,356 | 1,277 | 6% | 7% | ||||||||||||||||||||
|
Media (1)
|
86 | 85 | 1 | % | 2 | % | 324 | 331 | (2%) | (3%) | ||||||||||||||||||||
|
Markets division
|
1,921 | 1,914 | - | 1 | % | 7,441 | 7,535 | (1%) | (2%) | |||||||||||||||||||||
|
Eliminations
|
(3 | ) | (3 | ) | (9 | ) | (8 | ) | ||||||||||||||||||||||
|
Revenues from ongoing businesses (1), (2)
|
3,441 | 3,331 | 3 | % | 2 | % | 12,911 | 12,778 | 1% | (1%) | ||||||||||||||||||||
|
Before currency
|
4 | % | 1% | |||||||||||||||||||||||||||
|
Revenues from disposals (1), (2)
|
17 | 26 | 159 | 219 | ||||||||||||||||||||||||||
|
Revenues
|
3,458 | 3,357 | 3 | % | 13,070 | 12,997 | 1% | |||||||||||||||||||||||
|
Operating profit
|
||||||||||||||||||||||||||||||
|
Legal(1)
|
255 | 267 | (4 | %) | 992 | 1,070 | (7%) | |||||||||||||||||||||||
|
Tax & Accounting (1)
|
109 | 101 | 8 | % | 214 | 212 | 1% | |||||||||||||||||||||||
|
Healthcare & Science
|
56 | 52 | 8 | % | 198 | 185 | 7% | |||||||||||||||||||||||
|
Professional division
|
420 | 420 | - | 1,404 | 1,467 | (4%) | ||||||||||||||||||||||||
|
Markets division
|
336 | 323 | 4 | % | 1,337 | 1,453 | (8%) | |||||||||||||||||||||||
|
Corporate & Other
|
(303 | ) | (281 | ) | (829 | ) | (929 | ) | ||||||||||||||||||||||
|
Amortization of other identifiable intangible assets
|
(146 | ) | (132 | ) | (545 | ) | (499 | ) | ||||||||||||||||||||||
|
Operating profit from ongoing businesses (1), (2)
|
307 | 330 | (7 | %) | 1,367 | 1,492 | (8%) | |||||||||||||||||||||||
|
Disposals (1), (2)
|
1 | - | 68 | 74 | ||||||||||||||||||||||||||
|
Other operating (losses) gains, net
|
(1 | ) | 16 | (16 | ) | 9 | ||||||||||||||||||||||||
|
Operating profit
|
307 | 346 | (11 | %) | 1,419 | 1,575 | (10%) | |||||||||||||||||||||||
Thomson Reuters Annual Report 2010
64
Reconciliation of operating profit to underlying operating profit
|
Three months ended
December 31,
|
|
Year ended
December 31,
|
||||||||||||||||||||||
|
(millions of U.S. dollars)
|
2010
|
2009
|
Change
|
2010
|
2009
|
Change
|
||||||||||||||||||
|
Operating profit
|
307 | 346 | (11 | %) | 1,419 | 1,575 | (10 | %) | ||||||||||||||||
|
Adjustments:
|
||||||||||||||||||||||||
|
Amortization of other identifiable intangible assets
|
146 | 132 | 545 | 499 | ||||||||||||||||||||
|
Integration programs expenses
|
173 | 163 | 463 | 506 | ||||||||||||||||||||
|
Fair value adjustments
|
42 | 35 | 117 | 170 | ||||||||||||||||||||
|
Other operating losses (gains), net
|
1 | (16 | ) | 16 | (9 | ) | ||||||||||||||||||
|
Disposals (1), (2)
|
(1 | ) | - | (68 | ) | (74 | ) | |||||||||||||||||
|
Underlying operating profit
|
668 | 660 | 1 | % | 2,492 | 2,667 | (7 | %) | ||||||||||||||||
|
Underlying operating profit margin
|
19.4 | % | 19.8 | % | (40 | ) bp | 19.3 | % | 20.9 | % | (160 | ) bp | ||||||||||||
bp = basis points.
Reconciliation of earnings attributable to common shareholders to adjusted earnings from continuing operations
|
Three months ended
December 31,
|
Year ended
December 31,
|
|||||||||||||||
|
(millions of U.S. dollars, except per share amounts)
|
2010
|
2009
|
2010
|
2009
|
||||||||||||
|
Earnings attributable to common shareholders
|
224 | 177 | 909 | 844 | ||||||||||||
|
Adjustments:
|
||||||||||||||||
|
Disposals (1), (2)
|
(1 | ) | - | (68 | ) | (74 | ) | |||||||||
|
Fair value adjustments
|
42 | 35 | 117 | 170 | ||||||||||||
|
Other operating losses (gains), net
|
1 | (16 | ) | 16 | (9 | ) | ||||||||||
|
Other finance (income) costs
|
(8 | ) | 178 | (28 | ) | 242 | ||||||||||
|
Other non-operating charge
|
- | 59 | - | 385 | ||||||||||||
|
Share of post tax earnings in equity method investees
|
(2 | ) | (5 | ) | (8 | ) | (7 | ) | ||||||||
|
Tax on above items (1)
|
(13 | ) | (7 | ) | (9 | ) | (9 | ) | ||||||||
|
Interim period effective tax rate normalization
|
22 | (9 | ) | - | - | |||||||||||
|
Amortization of other identifiable intangible assets
|
146 | 132 | 545 | 499 | ||||||||||||
|
Discrete tax items
|
(47 | ) | (175 | ) | (47 | ) | (531 | ) | ||||||||
|
Discontinued operations
|
- | (6 | ) | - | (23 | ) | ||||||||||
|
Dividends declared on preference shares
|
(1 | ) | - | (3 | ) | (2 | ) | |||||||||
|
Adjusted earnings from continuing operations
|
363 | 363 | 1,424 | 1,485 | ||||||||||||
|
Adjusted earnings per share from continuing operations
|
$ | 0.43 | $ | 0.44 | $ | 1.70 | $ | 1.78 | ||||||||
Division and business segment depreciation and amortization of computer software
|
Three months ended
December 31,
|
Year ended
December 31,
|
|||||||||||||||
|
(millions of U.S. dollars)
|
2010
|
2009
|
2010
|
2009
|
||||||||||||
|
Legal (1)
|
(74 | ) | (66 | ) | (285 | ) | (258 | ) | ||||||||
|
Tax & Accounting (1)
|
(25 | ) | (21 | ) | (96 | ) | (78 | ) | ||||||||
|
Healthcare & Science
|
(15 | ) | (15 | ) | (67 | ) | (67 | ) | ||||||||
|
Professional division
|
(114 | ) | (102 | ) | (448 | ) | (403 | ) | ||||||||
|
Markets division
|
(141 | ) | (170 | ) | (553 | ) | (619 | ) | ||||||||
|
Corporate & Other
|
(9 | ) | (9 | ) | (25 | ) | (27 | ) | ||||||||
|
Ongoing businesses (1), (2)
|
(264 | ) | (281 | ) | (1,026 | ) | (1,049 | ) | ||||||||
|
Disposals (1), (2)
|
(1 | ) | (2 | ) | (3 | ) | (8 | ) | ||||||||
|
Total
|
(265 | ) | (283 | ) | (1,029 | ) | (1,057 | ) | ||||||||
Thomson Reuters Annual Report 2010
65
Reconciliation of underlying operating profit to adjusted EBITDA (3)
|
(millions of U.S. dollars)
|
Year ended
December 31, 2010
|
|||
|
Underlying operating profit
|
2,492 | |||
|
Adjustments:
|
||||
|
Integration programs expenses
|
(463 | ) | ||
|
Depreciation and amortization of computer software from ongoing businesses
|
1,026 | |||
|
Adjusted EBITDA
|
3,055 | |||
|
Adjusted EBITDA margin
|
23.7 | % | ||
Reconciliation of net earnings to adjusted EBITDA
|
(millions of U.S. dollars)
|
Year ended
December 31, 2010
|
|||
|
Net Earnings
|
933 | |||
|
Adjustments:
|
||||
|
Tax Expense
|
139 | |||
|
Other finance (income), net
|
(28 | ) | ||
|
Net interest expense
|
383 | |||
|
Amortization of other identifiable intangible assets
|
545 | |||
|
Amortization of computer software
|
572 | |||
|
Depreciation
|
457 | |||
|
EBITDA
|
3,001 | |||
|
Adjustments:
|
||||
|
Share of post tax earnings in equity method investees
|
(8 | ) | ||
|
Other operating losses, net
|
16 | |||
|
Fair value adjustments
|
117 | |||
|
EBITDA from disposals (4)
|
(71 | ) | ||
|
Adjusted EBITDA
|
3,055 | |||
|
(1)
|
Results for 2009 have been restated to reflect the 2010 presentation.
|
|
(2)
|
Revenues and operating profit from ongoing businesses exclude the results of disposals, which are defined as businesses sold or held for sale that do not qualify as discontinued operations. This supplemental financial information excludes the Professional division’s BARBRI legal education business and Scandinavian Legal and Tax & Accounting businesses, which were announced for sale in 2011, from ongoing operations.
|
|
(3)
|
Thomson Reuters 2011 business outlook contained in this management’s discussion and analysis includes adjusted EBITDA margin, which is a non-IFRS financial measure.
|
|
(4) Operating profit from disposals
|
68
|
|
|
Depreciation and amortization of computer software from disposals
|
3
|
|
|
EBITDA from disposals
|
71
|
Thomson Reuters Annual Report 2010
66
APPENDIX C
CALCULATION OF RETURN ON INVESTED CAPITAL (ROIC)
We calculate ROIC as adjusted operating profit after net taxes paid expressed as a percentage of the average invested capital during the period. Invested capital represents our net operating assets that contribute to or arise from our post-tax adjusted operating profits.
The following table provides the calculation of our return on invested capital for 2010 and 2009.
|
(millions of U.S. dollars)
|
2010
|
2009 (1)
|
||||||
|
Calculation of adjusted operating profit after taxes
|
||||||||
|
Operating profit
|
1,419 | 1,575 | ||||||
|
Add / (Deduct):
|
||||||||
|
Amortization of other identifiable intangible assets
|
545 | 499 | ||||||
|
Fair value adjustments
|
117 | 170 | ||||||
|
Other operating losses (gains), net
|
16 | (9 | ) | |||||
|
Adjusted operating profit
|
2,097 | 2,235 | ||||||
|
Net cash taxes paid on operations (2)
|
(231 | ) | (193 | ) | ||||
|
Post-tax adjusted operating profit
|
1,866 | 2,042 | ||||||
|
Calculation of invested capital
|
||||||||
|
Trade and other receivables
|
1,809 | 1,742 | ||||||
|
Prepaid expenses and other current assets
|
912 | 734 | ||||||
|
Computer hardware and other property, net
|
1,567 | 1,546 | ||||||
|
Computer software, net
|
1,613 | 1,495 | ||||||
|
Other identifiable intangible assets (excludes accumulated amortization)
|
12,191 | 11,603 | ||||||
|
Goodwill (3)
|
16,351 | 15,723 | ||||||
|
Payables, accruals and provisions
|
(2,924 | ) | (2,651 | ) | ||||
|
Deferred revenue
|
(1,300 | ) | (1,187 | ) | ||||
|
Present value of operating leases (4)
|
1,322 | 1,344 | ||||||
|
Total invested capital
|
31,541 | 30,349 | ||||||
|
Average invested capital
|
30,945 | 29,850 | ||||||
|
Return on invested capital
|
6.0 | % | 6.8 | % | ||||
|
(1)
|
Our 2009 calculation of ROIC has been restated to be comparable to our 2010 presentation. Specifically, the calculation was simplified to facilitate the reconciliation of its components to the statement of financial position reported under IFRS.
|
|
(2)
|
Excludes cash taxes paid on the disposal of businesses and investments.
|
|
(3)
|
Goodwill excludes non-cash amounts arising from the recognition of deferred taxes resulting from acquisition accounting of $2.5 billion and $2.4 billion in 2010 and 2009, respectively.
|
|
(4)
|
Present value of operating leases primarily for real property and equipment contracted in the ordinary course of business.
|
Thomson Reuters Annual Report 2010
67
APPENDIX D
CRITICAL ACCOUNTING ESTIMATES AND JUDGMENTS
The preparation of financial statements requires management to make estimates and judgments about the future. Estimates and judgments are continually evaluated and are based on historical experience and other factors, including expectations of future events that are believed to be reasonable under the circumstances. Accounting estimates will, by definition, seldom equal the actual results. The following discussion sets forth management’s:
|
|
●
|
most critical estimates and assumptions in determining the value of assets and liabilities; and
|
|
|
●
|
most critical judgments in applying accounting policies.
|
Critical accounting estimates and assumptions
Allowance for doubtful accounts and sales adjustments
We must make an assessment of whether accounts receivable are collectible from customers. Accordingly, we establish an allowance for estimated losses arising from non-payment and other sales adjustments, taking into consideration customer creditworthiness, current economic trends and past experience. If future collections differ from estimates, future earnings would be affected. At December 31, 2010, the combined allowances were $134 million, or 7%, of the gross trade accounts receivable balance of approximately $1.9 billion. An increase to the reserve based on 1% of accounts receivable would have decreased pre-tax earnings by approximately $19 million for the year ended December 31, 2010.
Computer software
Computer software represented approximately $1.6 billion of total assets on our consolidated statement of financial position at December 31, 2010. A significant portion of ongoing expenditures relate to software that is developed as part of electronic databases, delivery systems and internal infrastructures, and, to a lesser extent, software sold directly to customers. As part of the software development process, we must estimate the expected period of benefit over which capitalized costs should be amortized. The considerations which form the basis of the assumptions for these estimated useful lives include the timing of technological obsolescence and competitive pressures, as well as historical experience and internal business plans for the projected use of the software. Due to rapidly changing technology and the uncertainty of the software development process itself, future results could be affected if our current assessment of our software projects differs from actual performance.
Other identifiable intangible assets and goodwill
Other identifiable intangible assets and goodwill represented approximately $27.6 billion of total assets on our consolidated statement of financial position at December 31, 2010. These assets arise out of business combinations. In 2010, we spent $612 million in net cash consideration on acquisitions. Additionally, acquisitions included an exchange of equity interests involving our Tradeweb business (see the section entitled “Tradeweb”). These transactions were accounted for under the acquisition method of accounting, which involves the allocation of the cost of an acquisition to the underlying net assets acquired based on their respective estimated fair values. As part of this allocation process, we must identify and attribute values and estimated lives to the intangible assets acquired. These determinations involve significant estimates and assumptions regarding cash flow projections, economic risk and weighted cost of capital.
These estimates and assumptions determine the amount allocated to other identifiable intangible assets and goodwill, as well as the amortization period for identifiable intangible assets with finite lives. If future events or results differ adversely from these estimates and assumptions, we could record increased amortization or impairment charges in the future.
Valuation Techniques
An impairment of goodwill occurs when the estimated fair value less cost to sell of a cash generating unit (CGU) is below the carrying value of the CGU. We did not make any changes to the valuation methodology used to assess goodwill impairment since the last annual impairment test. The recoverable value of each CGU was based on fair value less cost to sell, using a weighted average of the following two methods to estimate fair value:
Income approach
The income approach is predicated upon the value of the future cash flows that a business will generate going forward. The discounted cash flow (DCF) method was used which involves projecting cash flows and converting them into a present value equivalent through discounting. The discounting process uses a rate of return that is commensurate with the risk associated with the business or asset and the time value of money. This approach requires assumptions about revenue growth rates, operating margins, tax rates and discount rates.
Thomson Reuters Annual Report 2010
68
Market approach
The market approach assumes that companies operating in the same industry will share similar characteristics and that company values will correlate to those characteristics. Therefore, a comparison of a CGU to similar companies whose financial information is publicly available may provide a reasonable basis to estimate fair value. Under the market approach, fair value is calculated based on EBITDA multiples of benchmark companies comparable to the businesses in each CGU. Data for the benchmark companies was obtained from publicly available information.
Significant Assumptions
Weighting of Valuation Techniques
We weighted the results of the two valuation techniques noted above, consistently applied to each CGU, as follows: 60% income approach/40% market approach. We believe that given volatility in capital markets, it is appropriate to apply a heavier weighting to the income approach. The selection and weighting of the fair value techniques requires judgment.
Growth
The assumptions used were based on our internal budget. We projected revenue, operating margins and cash flows for a period of five years, and applied a perpetual long-term growth rate thereafter. In arriving at our forecasts, we considered past experience, economic trends such as GDP growth and inflation as well as industry and market trends. The projections also took into account the expected impact from new product initiatives, customer retention and integration programs, and the maturity of the markets in which each business operates.
Discount Rate
We assumed a discount rate in order to calculate the present value of its projected cash flows. The discount rate represented a weighted average cost of capital (WACC) for comparable companies operating in similar industries as the applicable CGU, based on publicly available information. The WACC is an estimate of the overall required rate of return on an investment for both debt and equity owners and serves as the basis for developing an appropriate discount rate. Determination of the WACC requires separate analysis of the cost of equity and debt, and considers a risk premium based on an assessment of risks related to the projected cash flows of each unit.
Lower discount rates were applied to CGUs whose cash flows are expected to be less volatile due to factors such as the maturity of the market they serve and their market position. Higher discount rates were applied to CGUs whose cash flows are expected to be more volatile due to competition, or participation in less stable geographic markets.
Tax Rate
The tax rates applied to the projections reflected intercompany transfer pricing agreements currently in effect which were assumed to be transferable to another market participant. In certain circumstances, the effective tax rates, which ranged from 41% to 25%, were below the statutory tax rates. Tax assumptions are sensitive to changes in tax laws as well as assumptions about the jurisdictions in which profits are earned. It is possible that actual tax rates could differ from those assumed.
The key assumptions used in performing the impairment test, by CGU, were as follows:
|
Markets
|
West
|
All Other
|
||||||||||
|
Discount rate
|
9.5 | % | 7.5 | % | 7.6% - 11.2 | % | ||||||
|
Perpetual growth rate
|
3.0 | % | 2.0 | % | 3.0 | % | ||||||
The fair value for each CGU was in excess of its carrying value. The excess ranged from 17% to 898% of the carrying value of the applicable CGU. Based on sensitivity analysis, no reasonably possible change in assumptions would cause the carrying amount of any CGU to exceed its recoverable amount.
Thomson Reuters Annual Report 2010
69
Employee future benefits
We sponsor defined benefit plans providing pension and other post-employment benefits to covered employees. The determination of expense and obligations associated with employee future benefits requires the use of assumptions such as the expected return on assets available to fund pension obligations, the discount rate to measure obligations, the expected mortality, the expected rate of future compensation and the expected healthcare cost trend rate. Because the determination of the cost and obligations associated with employee future benefits requires the use of various assumptions, there is measurement uncertainty inherent in the actuarial valuation process. Actual results will differ from results which are estimated based on assumptions.
Discount rate
The discount rate was selected based on a review of current market interest rates of high-quality, fixed-rate debt securities adjusted to reflect the duration of expected future cash outflows for pension benefit payments. Because we have a relatively young workforce, the expected future cash outflows for our plans tend to be of longer duration than the bond indices reviewed. Therefore, the discount rate used for our plans tends to be higher than these benchmark rates. To estimate the discount rate, our actuary constructed a hypothetical yield curve that represented yields on high quality zero-coupon bonds with durations that mirrored the expected payment stream of the benefit obligation. For the Thomson Reuters Group Pension Plan (TRGP) and Reuters Pension Fund (RPF), a 0.25% increase or decrease in the discount rate would have decreased or increased the defined benefit obligation by approximately $155 million as of December 31, 2010.
Expected rate of return on assets
We must make assumptions about the expected long-term rate of return on plan assets, but there is no assurance that a plan will be able to earn the assumed rate of return. In determining the long-term rate of return assumption, we consider historical returns, input from investment advisors and our actuary’s simulation model of expected long-term rates of return assuming our targeted investment portfolio mix. For the TRGP and RPF, a 0.25% increase or decrease in the expected rate of return on assets would decrease or increase pension expense by approximately $8 million in 2011.
Medical cost trend
The medical cost trend is based on our actuarial medical claims experience and future projections of medical costs. The average medical cost trend rate used was 7.5% for 2010, which is reduced ratably to 5% in 2016. A 1% increase or decrease in the trend rate would have resulted in an increase or decrease in the benefit obligation for post-retirement benefits of approximately $17 million at December 31, 2010 and an increase or decrease in the service and interest costs of approximately $1 million in 2010.
Mortality assumptions
The mortality assumptions used to assess the defined benefit obligation for the TRGP and the RPF as of December 31, 2010 are based on the UP94 Generational Table and the 00 Series Tables issued by the Continuous Mortality Investigation Bureau with allowance for projected longevity improvements and adjustment for the medium cohort effect, respectively. For the TRGP and the RPF, an increase in life expectancy of one year across all age groups would result in a $65 million increase in the defined benefit obligation as of December 31, 2010.
Income taxes
We compute an income tax provision in each of the jurisdictions in which we operate. However, actual amounts of income tax expense only become final upon filing and acceptance of the tax return by the relevant authorities, which occur subsequent to the issuance of the financial statements. Additionally, estimation of income taxes includes evaluating the recoverability of deferred tax assets based on an assessment of the ability to use the underlying future tax deductions before they expire against future taxable income. The assessment is based upon existing tax laws and estimates of future taxable income. To the extent estimates differ from the final tax return, earnings would be affected in a subsequent period.
In interim periods, the income tax provision is based on estimates of full-year earnings by jurisdiction. The average annual effective income tax rates are re-estimated at each interim reporting date. To the extent that forecasts differ from actual results, adjustments are recorded in subsequent periods.
Our 2010 effective tax rate was 13% of earnings from continuing operations before tax. A 1% increase in the effective tax rate would have increased 2010 income tax expense by approximately $11 million.
Thomson Reuters Annual Report 2010
70
Critical judgments in applying accounting policies
Revenue recognition
As described in note 1 to our 2010 financial statements, we assess the criteria for the recognition of revenue related to arrangements that have multiple components. These assessments require that we make judgments to determine if there are separately identifiable components as well as how to allocate the total price among the components. Deliverables are accounted for as separately identifiable components if they can be understood without reference to the series of transactions as a whole. In concluding whether components are separately identifiable, we consider the transaction from the customer’s perspective. Among other factors, we assess whether the service or good is sold separately by us in the normal course of business or whether the customer could purchase the service or good separately. With respect to the allocation of price among components, we use our judgment to assign a fair value to each component. As evidence of fair value, we look to such items as the price for the component when sold separately, renewal rates for specific components and prices for a similar product sold separately.
Uncertain tax positions
We are subject to taxation in numerous jurisdictions. There are many transactions and calculations during the course of business for which the ultimate tax determination is uncertain. We maintain provisions for uncertain tax positions that we believe appropriately reflect our risk. These provisions are made using the best estimate of the amount expected to be paid based on a qualitative assessment of all relevant factors. We review the adequacy of these provisions at the end of the reporting period. However, it is possible that at some future date, liabilities in excess of our provisions could result from audits by, or litigation with, the IRS or other relevant taxing authorities. Where the final outcome of these tax-related matters is different from the amounts that were initially recorded, such differences will affect the tax provisions in the period in which such determination is made.
Thomson Reuters Annual Report 2010
71
APPENDIX E
SELECTED ANNUAL INFORMATION
The following table summarizes selected annual information for 2010, 2009 and 2008.
On April 17, 2008, we acquired Reuters for total consideration of approximately $16.0 billion. Results for Reuters are included in our financial statements as of the closing date of the acquisition, and reflect the continuing costs of our integration programs thereafter as well as the benefits of savings realized from those programs. For informational purposes, we have also provided pro forma results for 2008, which present the hypothetical performance of our business as if Reuters had been part of our company for all of 2008 (1).
2009 was the first full year of Thomson Reuters, a year of challenge due to the global economic recession, and achievement, as we executed on our strategic priorities and delivered an increase in underlying operating margin, driven by continued progress on integration programs, strong cost management and the benefit of currency. With the worst of the economic downturn stemming from the financial crisis behind us, we entered 2010 with positive sales momentum. However, given the subscription nature of our business, the impact of negative net sales in 2009 affected our revenues in 2010 and we were slower to return to growth than other businesses. Our business mix has also been transforming over the last two years as we continue to invest in higher-growth segments and newly acquired businesses. However, these investments and acquisitions are initially dilutive to our margins. At the same time, our higher-margin print and non-subscription revenues declined through the economic recession, but have stabilized at lower levels as markets continue to recover. Our strong financial position and attractive business model, which is highly-cash flow generative, enabled us to continue making investments in our business, maintaining stable debt levels while increasing total assets.
See “Results of Operations” for a full discussion of our performance in 2010 compared to 2009.
|
For the years ended and as at December 31,
|
||||||||||||
|
(millions of U.S. dollars, except per share amounts)
|
2010
|
2009
|
2008
|
|||||||||
|
Consolidated Income Statement Data:
|
||||||||||||
|
Revenues
|
13,070 | 12,997 | 11,707 | |||||||||
|
Operating profit
|
1,419 | 1,575 | 1,668 | |||||||||
|
Earnings from continuing operations
|
933 | 844 | 1,320 | |||||||||
|
Net earnings
|
933 | 867 | 1,321 | |||||||||
|
Basic earnings per share from continuing operations
|
$ | 1.09 | $ | 0.99 | $ | 1.69 | ||||||
|
Basic earnings per share
|
$ | 1.09 | $ | 1.01 | $ | 1.69 | ||||||
|
Diluted earnings per share from continuing operations
|
$ | 1.08 | $ | 0.99 | $ | 1.68 | ||||||
|
Diluted earnings per share
|
$ | 1.08 | $ | 1.01 | $ | 1.68 | ||||||
|
Consolidated Statement of Financial Position Data:
|
||||||||||||
|
Total assets
|
35,531 | 34,573 | 34,589 | |||||||||
|
Total long-term financial liabilities (2)
|
6,944 | 6,863 | 7,005 | |||||||||
|
Dividend Data:
|
||||||||||||
|
Dividends per Thomson Reuters Corporation common share (US$)
|
$ | 1.16 | $ | 1.12 | $ | 1.08 | ||||||
|
Dividends per Thomson Reuters PLC ordinary share (US$) (3)
|
- | $ | 0.84 | $ | 0.49 | |||||||
|
Dividends per Thomson Reuters Corporation Series II preference share (C$)
|
$ | C0.45 | $ | C0.43 | $ | C0.85 | ||||||
|
Non-IFRS and Pro forma Data (unaudited) (1), (4):
|
||||||||||||
|
Revenues from ongoing businesses
|
13,069 | 12,948 | 13,283 | |||||||||
|
Underlying operating profit
|
2,560 | 2,754 | 2,778 | |||||||||
|
Underlying operating profit margin
|
19.6 | % | 21.3 | % | 20.9 | % | ||||||
|
Adjusted earnings from continuing operations
|
1,469 | 1,541 | 1,512 | |||||||||
|
Adjusted earnings per share from continuing operations
|
$ | 1.76 | $ | 1.85 | $ | 1.82 | ||||||
|
Net debt
|
6,389 | 6,383 | 6,760 | |||||||||
|
Free cash flow
|
1,563 | 1,570 | 1,817 | |||||||||
|
Underlying free cash flow
|
2,013 | 2,058 | 1,885 | |||||||||
|
(1)
|
See Appendix A in each of our 2009 and 2008 annual management’s discussion and analysis for additional information on our 2008 pro forma results.
|
|
(2)
|
Long-term financial liabilities are comprised of “Long-term indebtedness” and “Other financial liabilities” classified as non-current on our consolidated statement of financial position.
|
|
(3)
|
On September 10, 2009, all Thomson Reuters PLC ordinary shares were exchanged for an equivalent number of Thomson Reuters Corporation common shares in connection with unification of the dual listed company (DLC) structure which existed as a result of the Reuters acquisition. See note 24 of our 2010 annual financial statements for additional information about the DLC unification.
|
|
(4)
|
See Appendix A of this 2010 annual management’s discussion and analysis for additional information on non-IFRS financial measures.
|
Thomson Reuters Annual Report 2010
72
APPENDIX F
QUARTERLY INFORMATION (UNAUDITED)
The following table presents a summary of our consolidated operating results for the eight most recent quarters.
|
Quarter ended
March 31,
|
Quarter ended
June 30,
|
Quarter ended
September 30,
|
Quarter ended
December 31,
|
|||||||||||||||||||||||||||||
|
(millions of U.S. dollars, except per share amounts)
|
2010
|
2009
|
2010
|
2009
|
2010
|
2009
|
2010
|
2009
|
||||||||||||||||||||||||
|
Revenues
|
3,140 | 3,131 | 3,216 | 3,293 | 3,256 | 3,216 | 3,458 | 3,357 | ||||||||||||||||||||||||
|
Operating profit
|
321 | 376 | 435 | 475 | 356 | 378 | 307 | 346 | ||||||||||||||||||||||||
|
Earnings from continuing operations
|
134 | 189 | 303 | 323 | 271 | 156 | 225 | 176 | ||||||||||||||||||||||||
|
Earnings (loss) from discontinued operations, net of tax
|
- | 4 | (6 | ) | 2 | 6 | 11 | - | 6 | |||||||||||||||||||||||
|
Net earnings
|
134 | 193 | 297 | 325 | 277 | 167 | 225 | 182 | ||||||||||||||||||||||||
|
Earnings attributable to common shares
|
127 | 190 | 290 | 315 | 268 | 162 | 224 | 177 | ||||||||||||||||||||||||
|
Dividends declared on preference shares
|
(1 | ) | (1 | ) | - | - | (1 | ) | (1 | ) | (1 | ) | - | |||||||||||||||||||
|
Basic earnings per share
|
||||||||||||||||||||||||||||||||
|
From continuing operations
|
$ | 0.15 | $ | 0.22 | $ | 0.36 | $ | 0.38 | $ | 0.31 | $ | 0.18 | $ | 0.27 | $ | 0.21 | ||||||||||||||||
|
From discontinued operations
|
- | 0.01 | (0.01 | ) | - | 0.01 | 0.01 | - | - | |||||||||||||||||||||||
| $ | 0.15 | $ | 0.23 | $ | 0.35 | $ | 0.38 | $ | 0.32 | $ | 0.19 | $ | 0.27 | $ | 0.21 | |||||||||||||||||
|
Diluted earnings per share
|
||||||||||||||||||||||||||||||||
|
From continuing operations
|
$ | 0.15 | $ | 0.22 | $ | 0.36 | $ | 0.38 | $ | 0.31 | $ | 0.18 | $ | 0.27 | $ | 0.21 | ||||||||||||||||
|
From discontinued operations
|
- | 0.01 | (0.01 | ) | - | 0.01 | 0.01 | - | - | |||||||||||||||||||||||
| $ | 0.15 | $ | 0.23 | $ | 0.35 | $ | 0.38 | $ | 0.32 | $ | 0.19 | $ | 0.27 | $ | 0.21 | |||||||||||||||||
Our revenues and operating profits do not tend to be significantly impacted by seasonality as we record a large portion of our revenues ratably over a contract term and our costs, excluding integration programs expenses, are generally incurred evenly throughout the year. However, our non-recurring revenues can cause changes in our performance from quarter to consecutive quarter. Additionally, the release of certain print-based offerings can be seasonal as can certain product releases for the regulatory markets, which tend to be concentrated at the end of the year.
Results for all periods presented reflect both the expenses and savings benefits of the integration programs we commenced in 2008 related to the Reuters acquisition.
Our results for the first and second quarters of 2010 reflected the impact of negative net sales in 2009 on our subscription revenues and associated reductions in recoveries revenues. However, positive consolidated net sales throughout 2010 contributed to higher revenues, with a return to year-over-year revenue growth (before currency) in the third quarter of 2010. High-margin, non-subscription and print-related revenues declined in our Professional division through the first three-quarters of 2010. However, print attrition in particular has returned to historic levels and higher transaction levels have been experienced in selected areas in both our Professional and Markets divisions as economic recovery continues. The return to revenue growth in the latter half of 2010 contributed to higher operating profit, however, continued investment in new product launches and the dilutive impacts of several acquisitions, particularly in our Legal segment, have held back near term operating profit growth. Net earnings were also affected by a $62 million loss associated with our early redemption of debt securities in the first quarter of 2010.
In 2009, our results were adversely affected by the global economic recession including a change in the mix of revenues, as higher-margin print-based and non-subscription revenues decreased, while other lower-margin but higher growth businesses expanded.
Given the global nature of our business, our results are also affected by changes in exchange rates. On balance, given our currency mix of revenues and expenses around the world, fluctuations in exchange rates between the U.S. dollar and other major currencies caused less variability from quarter to quarter in our results in 2010 than the variability we experienced in 2009. In 2010, foreign currency did not impact our revenues, but had a small negative impact on underlying operating profit margin. In 2009, the strengthening U.S. dollar against other major currencies negatively affected revenues, but had a positive effect on underlying operating profit margin.
Thomson Reuters Annual Report 2010
73
CONSOLIDATED FINANCIAL STATEMENTS
Management’s Responsibility for the Consolidated Financial Statements
The management of Thomson Reuters Corporation (the “Company”) is responsible for the accompanying consolidated financial statements and other information included in this annual report. The financial statements have been prepared in conformity with International Financial Reporting Standards, as issued by the International Accounting Standards Board, using the best estimates and judgments of management, where appropriate. Information presented elsewhere in this annual report is consistent with that in the financial statements.
The Company’s board of directors is responsible for ensuring that management fulfills its responsibilities in respect of financial reporting and internal control. The Audit Committee of the board of directors meets periodically with management and the Company’s independent auditors to discuss auditing matters and financial reporting issues. In addition, the Audit Committee recommends to the board of directors the approval of the interim and annual consolidated financial statements and the annual appointment of the independent auditors. The board of directors has approved the information contained in the accompanying consolidated financial statements.
 |
 |
|
Thomas H. Glocer
|
Robert D. Daleo
|
|
Chief Executive Officer
|
Executive Vice President and Chief Financial Officer
|
|
March 9, 2011
|
Management’s Report on Internal Control over Financial Reporting
Management is responsible for establishing and maintaining adequate internal control over financial reporting.
Internal control over financial reporting is a process that was designed to provide reasonable assurance regarding the reliability of financial reporting and the preparation of financial statements for external purposes in accordance with International Financial Reporting Standards as issued by the International Accounting Standards Board (“IFRS”). Internal control over financial reporting includes those policies and procedures that (i) pertain to the maintenance of records that, in reasonable detail, accurately and fairly reflect the transactions and dispositions of the assets of Thomson Reuters Corporation (the “Company”); (ii) provide reasonable assurance that transactions are recorded as necessary to permit preparation of financial statements in accordance with IFRS, and that receipts and expenditures of the Company are being made only in accordance with authorizations of management and directors of the Company; and (iii) provide reasonable assurance regarding prevention or timely detection of unauthorized acquisition, use, or disposition of the Company’s assets that could have a material effect on the financial statements.
Because of its inherent limitations, internal control over financial reporting may not prevent or detect misstatements. Also, projections of any evaluation of effectiveness to future periods are subject to the risk that controls may become inadequate because of changes in conditions, or that the degree of compliance with the policies and procedures may deteriorate.
Management conducted an evaluation of the effectiveness of its system of internal control over financial reporting based on the framework and criteria established in Internal Control – Integrated Framework issued by the Committee of Sponsoring Organizations of the Treadway Commission. Based on this evaluation, management concluded that the Company’s internal control over financial reporting was effective as of December 31, 2010.
The effectiveness of the Company’s internal control over financial reporting as of December 31, 2010 has been audited by PricewaterhouseCoopers LLP, independent auditors, as stated in their report which appears herein.
|
|
|
|
Thomas H. Glocer
|
Robert D. Daleo
|
|
Chief Executive Officer
|
Executive Vice President and Chief Financial Officer
|
|
March 9, 2011
|
Thomson Reuters Annual Report 2010
74
Independent Auditor’s Report
March 9, 2011
TO THE SHAREHOLDERS OF THOMSON REUTERS CORPORATION:
We have completed integrated audits of Thomson Reuters Corporation’s and its subsidiaries' (the "Company") 2010 and 2009 consolidated financial statements and of its internal control over financial reporting as at December 31, 2010. Our opinions, based on our audits, are presented below.
Report on the Consolidated Financial Statements
We have audited the accompanying consolidated financial statements of Thomson Reuters Corporation and its subsidiaries, which comprise the consolidated statement of financial position as of December 31, 2010 and 2009 and the consolidated income statement and consolidated statements of comprehensive income, cash flow and changes in equity for the years then ended, and the related notes including a summary of significant accounting policies.
Management's responsibility for the consolidated financial statements
Management is responsible for the preparation and fair presentation of these consolidated financial statements in accordance with International Financial Reporting Standards as issued by the International Accounting Standards Board and for such internal control as management determines is necessary to enable the preparation of consolidated financial statements that are free from material misstatement, whether due to fraud or error.
Auditor’s responsibility
Our responsibility is to express an opinion on these consolidated financial statements based on our audits. We conducted our audits in accordance with Canadian generally accepted auditing standards and the standards of the Public Company Accounting Oversight Board (United States). Those standards require that we plan and perform an audit to obtain reasonable assurance whether the consolidated financial statements are free from material misstatement. Canadian generally accepted auditing standards require that we comply with ethical requirements.
An audit involves performing procedures to obtain audit evidence, on a test basis, about the amounts and disclosures in the consolidated financial statements. The procedures selected depend on the auditor’s judgment, including the assessment of the risks of material misstatement of the consolidated financial statements, whether due to fraud or error. In making those risk assessments, the auditor considers internal control relevant to the company’s preparation and fair presentation of the consolidated financial statements in order to design audit procedures that are appropriate in the circumstances. An audit also includes evaluating the appropriateness of accounting principles and policies used and the reasonableness of accounting estimates made by management, as well as evaluating the overall presentation of the consolidated financial statements.
We believe that the audit evidence we have obtained in our audits is sufficient and appropriate to provide a basis for our audit opinion on the consolidated financial statements.
Opinion
In our opinion, the consolidated financial statements present fairly, in all material respects, the financial position of Thomson Reuters Corporation and its subsidiaries as at December 31, 2010 and 2009 and the results of its operations and cash flows for the years then ended in accordance with International Financial Reporting Standards as issued by the International Accounting Standards Board.
Report on Internal Control over Financial Reporting
We have also audited Thomson Reuters Corporation internal control over financial reporting as at December 31, 2010, based on criteria established in Internal Control - Integrated Framework, issued by the Committee of Sponsoring Organizations of the Treadway Commission (COSO).
Management’s responsibility for internal control over financial reporting
Management is responsible for maintaining effective internal control over financial reporting and for its assessment of the effectiveness of internal control over financial reporting, included in the accompanying Management’s Report on Internal Control over Financial Reporting.
Thomson Reuters Annual Report 2010
75
Auditor’s responsibility
Our responsibility is to express an opinion on the Company’s internal control over financial reporting based on our audit. We conducted our audit of internal control over financial reporting in accordance with the standards of the Public Company Accounting Oversight Board (United States). Those standards require that we plan and perform the audit to obtain reasonable assurance about whether effective internal control over financial reporting was maintained in all material respects.
An audit of internal control over financial reporting includes obtaining an understanding of internal control over financial reporting, assessing the risk that a material weakness exists, testing and evaluating the design and operating effectiveness of internal control based on the assessed risk, and performing such other procedures as we consider necessary in the circumstances.
We believe that our audit provides a reasonable basis for our audit opinion on the Company's internal control over financial reporting.
Definition of internal control over financial reporting
A company’s internal control over financial reporting is a process designed to provide reasonable assurance regarding the reliability of financial reporting and the preparation of financial statements for external purposes in accordance with generally accepted accounting principles. A company’s internal control over financial reporting includes those policies and procedures that (i) pertain to the maintenance of records that, in reasonable detail, accurately and fairly reflect the transactions and dispositions of the assets of the company; (ii) provide reasonable assurance that transactions are recorded as necessary to permit preparation of financial statements in accordance with generally accepted accounting principles, and that receipts and expenditures of the company are being made only in accordance with authorizations of management and directors of the company; and (iii) provide reasonable assurance regarding prevention or timely detection of unauthorized acquisition, use, or disposition of the company’s assets that could have a material effect on the financial statements.
Inherent limitations
Because of its inherent limitations, internal control over financial reporting may not prevent or detect misstatements. Also, projections of any evaluation of effectiveness to future periods are subject to the risk that controls may become inadequate because of changes in conditions, or that the degree of compliance with the policies or procedures may deteriorate.
Opinion
In our opinion, the Company maintained, in all material respects, effective internal control over financial reporting as at December 31, 2010 based on criteria established in Internal Control — Integrated Framework issued by COSO.

Chartered Accountants, Licensed Public Accountants
Toronto, Canada
Thomson Reuters Annual Report 2010
76
THOMSON REUTERS CORPORATION
CONSOLIDATED INCOME STATEMENT
|
Year ended December 31,
|
|||||||||
|
(millions of U.S. dollars, except per share amounts)
|
Notes
|
2010
|
2009
|
||||||
|
Revenues
|
13,070
|
12,997
|
|||||||
|
Operating expenses
|
5
|
(10,061
|
)
|
(9,875
|
) | ||||
|
Depreciation
|
(457
|
)
|
(509
|
) | |||||
|
Amortization of computer software
|
(572
|
)
|
(548
|
) | |||||
|
Amortization of other identifiable intangible assets
|
(545
|
)
|
(499
|
) | |||||
|
Other operating (losses) gains, net
|
6
|
(16
|
)
|
9
|
|||||
|
Operating profit
|
1,419
|
1,575
|
|||||||
|
Finance costs, net:
|
|||||||||
|
Net interest expense
|
7
|
(383
|
)
|
(410
|
) | ||||
|
Other finance income (costs)
|
7
|
28
|
(242
|
) | |||||
|
Other non-operating charge
|
8
|
-
|
(385
|
) | |||||
|
Income before tax and equity method investees
|
1,064
|
538
|
|||||||
|
Share of post tax earnings in equity method investees
|
8
|
7
|
|||||||
|
Tax (expense) benefit
|
9
|
(139
|
)
|
299
|
|||||
|
Earnings from continuing operations
|
933
|
844
|
|||||||
|
Earnings from discontinued operations, net of tax
|
10
|
-
|
23
|
||||||
|
Net earnings
|
933
|
867
|
|||||||
|
Earnings attributable to:
|
|||||||||
|
Common shareholders
|
909
|
844
|
|||||||
|
Non-controlling interests
|
28
|
24
|
23
|
||||||
|
Earnings per share:
|
11
|
||||||||
|
Basic earnings per share:
|
|||||||||
|
From continuing operations
|
$ |
1.09
|
$ |
0.99
|
|||||
|
From discontinued operations
|
-
|
0.02
|
|||||||
|
Basic earnings per share
|
$ |
1.09
|
$ |
1.01
|
|||||
|
Diluted earnings per share:
|
|||||||||
|
From continuing operations
|
$ |
1.08
|
$ |
0.99
|
|||||
|
From discontinued operations
|
-
|
0.02
|
|||||||
|
Diluted earnings per share
|
$ |
1.08
|
$ |
1.01
|
|||||
The related notes form an integral part of these consolidated financial statements.
Thomson Reuters Annual Report 2010
77
THOMSON REUTERS CORPORATION
CONSOLIDATED STATEMENT OF COMPREHENSIVE INCOME
|
Year ended December 31,
|
|||||||||
|
(millions of U.S. dollars)
|
Notes
|
2010
|
2009
|
||||||
|
Net earnings
|
933
|
867
|
|||||||
|
Other comprehensive (loss) income:
|
|||||||||
|
Net gain on cash flow hedges
|
113
|
296
|
|||||||
|
Net (gain) on cash flow hedges transferred to earnings
|
19
|
(123
|
)
|
(350
|
)
|
||||
|
Foreign currency translation adjustments to equity
|
9
|
678
|
|||||||
|
Foreign currency translation adjustments to earnings
|
(8
|
)
|
173
|
||||||
|
Net actuarial losses on defined benefit pension plans, net of tax(1)
|
26
|
(108
|
)
|
(4
|
)
|
||||
|
Other comprehensive (loss) income
|
(117
|
)
|
793
|
||||||
|
Total comprehensive income
|
816
|
1,660
|
|||||||
|
Comprehensive income for the period attributable to:
|
|||||||||
|
Common shareholders
|
792
|
1,637
|
|||||||
|
Non-controlling interests
|
28
|
24
|
23
|
||||||
|
(1)
|
The related tax benefit was $58 million and $7 million for the years ended December 31, 2010 and 2009, respectively.
|
The related notes form an integral part of these consolidated financial statements.
Thomson Reuters Annual Report 2010
78
THOMSON REUTERS CORPORATION
CONSOLIDATED STATEMENT OF FINANCIAL POSITION
|
December 31,
|
|||||||||
|
(millions of U.S. dollars)
|
Notes
|
2010
|
2009
|
||||||
|
ASSETS
|
|||||||||
|
Cash and cash equivalents
|
12
|
864
|
|
1,111
|
|||||
|
Trade and other receivables
|
13
|
1,809
|
1,742
|
||||||
|
Other financial assets
|
19
|
74
|
76
|
||||||
|
Prepaid expenses and other current assets
|
14
|
912
|
734
|
||||||
|
Current assets
|
3,659
|
3,663
|
|||||||
|
Computer hardware and other property, net
|
15
|
1,567
|
1,546
|
||||||
|
Computer software, net
|
16
|
1,613
|
1,495
|
||||||
|
Other identifiable intangible assets, net
|
17
|
8,714
|
8,694
|
||||||
|
Goodwill
|
18
|
18,892
|
18,130
|
||||||
|
Other financial assets
|
19
|
460
|
383
|
||||||
|
Other non-current assets
|
20
|
558
|
649
|
||||||
|
Deferred tax
|
23
|
68
|
13
|
||||||
|
Total assets
|
35,531
|
34,573
|
|||||||
|
LIABILITIES AND EQUITY
|
|||||||||
|
Liabilities
|
|||||||||
|
Current indebtedness
|
19
|
645
|
782
|
||||||
|
Payables, accruals and provisions
|
21
|
2,924
|
2,651
|
||||||
|
Deferred revenue
|
1,300
|
1,187
|
|||||||
|
Other financial liabilities
|
19
|
142
|
92
|
||||||
|
Current liabilities
|
5,011
|
4,712
|
|||||||
|
Long-term indebtedness
|
19
|
6,873
|
6,821
|
||||||
|
Provisions and other non-current liabilities
|
22
|
2,217
|
1,878
|
||||||
|
Other financial liabilities
|
19
|
71
|
42
|
||||||
|
Deferred tax
|
23
|
1,684
|
1,785
|
||||||
|
Total liabilities
|
15,856
|
15,238
|
|||||||
|
Equity
|
|||||||||
|
Capital
|
24
|
10,284
|
10,177
|
||||||
|
Retained earnings
|
10,518
|
10,561
|
|||||||
|
Accumulated other comprehensive loss
|
(1,480)
|
(1,471)
|
|
||||||
|
Total shareholders’ equity
|
19,322
|
19,267
|
|||||||
|
Non-controlling interests
|
28
|
353
|
68
|
||||||
|
Total equity
|
19,675
|
19,335
|
|||||||
|
Total liabilities and equity
|
35,531
|
34,573
|
|||||||
|
Contingencies (note 29)
|
|||||||||
The related notes form an integral part of these consolidated financial statements.
These financial statements were approved by the Company’s board of directors on March 2, 2011.
 |
|
|
David Thomson
|
Thomas H. Glocer
|
|
Director
|
Director
|
Thomson Reuters Annual Report 2010
79
THOMSON REUTERS CORPORATION
CONSOLIDATED STATEMENT OF CASH FLOW
|
Year ended December 31,
|
|||||||||
|
(millions of U.S. dollars)
|
Notes
|
2010
|
2009
|
||||||
|
Cash provided by (used in):
|
|||||||||
|
OPERATING ACTIVITIES
|
|||||||||
|
Net earnings
|
933
|
867
|
|||||||
|
Adjustments for:
|
|||||||||
|
Depreciation
|
457
|
509
|
|||||||
|
Amortization of computer software
|
572
|
548
|
|||||||
|
Amortization of other identifiable intangible assets
|
545
|
499
|
|||||||
|
Deferred tax
|
23
|
(205
|
)
|
(544
|
)
|
||||
|
Embedded derivatives fair value adjustments
|
19
|
72
|
147
|
||||||
|
Net (gains) losses on foreign exchange and derivative financial instruments
|
(91
|
)
|
182
|
||||||
|
Other non-operating charge
|
8
|
-
|
385
|
||||||
|
Other
|
27
|
433
|
290
|
||||||
|
Changes in working capital and other items
|
27
|
(55
|
)
|
(219
|
)
|
||||
|
Operating cash flows from continuing operations
|
2,661
|
2,664
|
|||||||
|
Operating cash flows from discontinued operations
|
10
|
(6
|
)
|
2
|
|||||
|
Net cash provided by operating activities
|
2,655
|
2,666
|
|||||||
|
INVESTING ACTIVITIES
|
|||||||||
|
Acquisitions, less cash acquired
|
28
|
(612
|
)
|
(349
|
)
|
||||
|
Proceeds from other disposals, net of taxes paid
|
26
|
56
|
|||||||
|
Capital expenditures, less proceeds from disposals
|
(1,097
|
)
|
(1,097
|
)
|
|||||
|
Other investing activities
|
8
|
3
|
|||||||
|
Investing cash flows from continuing operations
|
(1,675
|
)
|
(1,387
|
)
|
|||||
|
Investing cash flows from discontinued operations
|
10
|
-
|
22
|
||||||
|
Net cash used in investing activities
|
(1,675
|
)
|
(1,365
|
)
|
|||||
|
FINANCING ACTIVITIES
|
|||||||||
|
Proceeds from debt
|
19
|
1,367
|
1,107
|
||||||
|
Repayments of debt
|
19
|
(1,683
|
)
|
(1,249
|
)
|
||||
|
Net borrowings under short-term loan facilities
|
5
|
4
|
|||||||
|
Dividends paid on preference shares
|
(3
|
)
|
(2
|
)
|
|||||
|
Dividends paid on common shares
|
24
|
(898
|
)
|
(905
|
)
|
||||
|
Other financing activities
|
(7
|
)
|
(6
|
)
|
|||||
|
Net cash used in financing activities
|
(1,219
|
)
|
(1,051
|
)
|
|||||
|
Translation adjustments on cash and cash equivalents
|
(8
|
)
|
20
|
||||||
|
(Decrease) increase in cash and cash equivalents
|
(247
|
)
|
270
|
||||||
|
Cash and cash equivalents at beginning of period
|
12
|
1,111
|
841
|
||||||
|
Cash and cash equivalents at end of period
|
12
|
864
|
1,111
|
||||||
|
Supplemental cash flow information is provided in note 27.
|
|||||||||
|
Interest paid
|
(393
|
)
|
(425
|
)
|
|||||
|
Interest received
|
7
|
8
|
|||||||
|
Income taxes paid
|
(243
|
)
|
(200
|
)
|
|||||
Amounts paid and received for interest are reflected as operating cash flows. Interest paid is net of debt related hedges.
Amounts paid for income taxes are reflected as either operating cash flows or investing cash flows depending upon the nature of the underlying transaction.
The related notes form an integral part of these consolidated financial statements.
Thomson Reuters Annual Report 2010
80
THOMSON REUTERS CORPORATION
CONSOLIDATED STATEMENT OF CHANGES IN EQUITY
|
(millions of U.S. dollars)
|
Stated share capital
|
Contributed surplus
|
Total capital
|
Retained earnings
|
Unrecognized (loss) gain on cash flow hedges
|
Foreign currency translation adjustments
|
Total accumulated other comprehensive (loss) income (“AOCI”)
|
Non-
controlling interests
|
Total
|
|||||||||||||||||||||||||||
|
Balance, December 31, 2009
|
9,957 | 220 | 10,177 | 10,561 | (33 | ) | (1,438 | ) | (1,471 | ) | 68 | 19,335 | ||||||||||||||||||||||||
|
Comprehensive income (loss)(1)
|
- | - | - | 801 | (10 | ) | 1 | (9 | ) | 24 | 816 | |||||||||||||||||||||||||
|
Change in ownership interest of subsidiary(2)
|
- | - | - | 125 | - | - | - | 291 | 416 | |||||||||||||||||||||||||||
|
Distributions to non-controlling interest
|
- | - | - | - | - | - | - | (30 | ) | (30 | ) | |||||||||||||||||||||||||
|
Dividends declared on preference shares
|
- | - | - | (3 | ) | - | - | - | - | (3 | ) | |||||||||||||||||||||||||
|
Dividends declared on common shares
|
- | - | - | (966 | ) | - | - | - | - | (966 | ) | |||||||||||||||||||||||||
|
Shares issued under Dividend Reinvestment Plan (“DRIP”)
|
68 | - | 68 | - | - | - | - | - | 68 | |||||||||||||||||||||||||||
|
Effect of stock compensation plans(3)
|
52 | (13 | ) | 39 | - | - | - | - | - | 39 | ||||||||||||||||||||||||||
|
Balance, December 31, 2010
|
10,077 | 207 | 10,284 | 10,518 | (43 | ) | (1,437 | ) | (1,480 | ) | 353 | 19,675 | ||||||||||||||||||||||||
|
(millions of U.S. dollars)
|
Stated share capital(4)
|
Contributed surplus
|
Total capital
|
Retained earnings
|
Unrecognized gain (loss) on cash flow hedges
|
Foreign currency translation adjustments
|
AOCI
|
Non-
controlling interests
|
Total
|
|||||||||||||||||||||||||||
|
Balance, December 31, 2008
|
3,050 | 6,984 | 10,034 | 10,650 | 21 | (2,289 | ) | (2,268 | ) | 72 | 18,488 | |||||||||||||||||||||||||
|
Comprehensive income (loss)(1)
|
- | - | - | 840 | (54 | ) | 851 | 797 | 23 | 1,660 | ||||||||||||||||||||||||||
|
Distributions to non-controlling interest
|
- | - | - | - | - | - | - | (27 | ) | (27 | ) | |||||||||||||||||||||||||
|
DLC unification(4)
|
6,828 | (6,828 | ) | - | - | - | - | - | - | - | ||||||||||||||||||||||||||
|
Dividends declared on preference shares
|
- | - | - | (2 | ) | - | - | - | - | (2 | ) | |||||||||||||||||||||||||
|
Dividends declared on common shares
|
- | - | - | (927 | ) | - | - | - | - | (927 | ) | |||||||||||||||||||||||||
|
Shares issued under DRIP
|
22 | - | 22 | - | - | - | - | - | 22 | |||||||||||||||||||||||||||
|
Effect of stock compensation plans
|
57 | 64 | 121 | - | - | - | - | - | 121 | |||||||||||||||||||||||||||
|
Balance, December 31, 2009
|
9,957 | 220 | 10,177 | 10,561 | (33 | ) | (1,438 | ) | (1,471 | ) | 68 | 19,335 | ||||||||||||||||||||||||
|
(1)
|
Retained earnings for the year ended December 31, 2010 includes actuarial losses of $108 million, net of tax, (2009 - $4 million).
|
|
(2)
|
Comprised of amounts relating to Tradeweb. See note 28.
|
|
(3)
|
Includes a reduction of $89 million relating to cash-settled awards. See note 1.
|
|
(4)
|
On September 10, 2009 all Thomson Reuters PLC ordinary shares were exchanged for an equivalent number of Thomson Reuters Corporation common shares in connection with unification of the dual listed company structure. Following unification, stated share capital includes common and preference share capital. See note 24.
|
The related notes form an integral part of these consolidated financial statements.
Thomson Reuters Annual Report 2010
81
THOMSON REUTERS CORPORATION
Notes to Consolidated Financial Statements
(unless otherwise stated, all amounts are in millions of U.S. dollars)
NOTE 1: SUMMARY OF BUSINESS AND SIGNIFICANT ACCOUNTING POLICIES
General business description
Thomson Reuters Corporation (the “Company” or “Thomson Reuters”) is an Ontario, Canada corporation with common shares listed on the Toronto Stock Exchange (“TSX”) and the New York Stock Exchange (“NYSE”) and Series II preference shares listed on the TSX. The Company provides intelligent information to businesses and professionals. Its offerings combine industry expertise with innovative technology to deliver critical information to decision makers.
These financial statements were approved by the Company’s board of directors on March 2, 2011.
Basis of preparation
These consolidated financial statements were prepared in accordance with International Financial Reporting Standards (“IFRS”), as issued by the International Accounting Standards Board (“IASB”), on an going concern basis, under the historical cost convention, as modified by the revaluation of financial assets and financial liabilities (including derivative instruments) at fair value through the income statement.
The preparation of financial statements in accordance with IFRS requires the use of certain critical accounting estimates. It also requires management to exercise judgment in applying the Company’s accounting policies. The areas involving a higher degree of judgment or complexity, or areas where assumptions and estimates are significant to the financial statements are disclosed in note 2.
Pronouncements effective prospectively from January 1, 2010
IAS 21, The Effects of Changes in Foreign Exchange Rates
Effective January 1, 2010, the Company adopted an amendment to International Accounting Standard (“IAS”) 21, The Effects of Changes in Foreign Exchange Rates as a consequential amendment of IAS 27 (2008), Consolidated and Separate Financial Statements. The amendment requires that accumulated foreign exchange differences are reclassified from equity to the income statement upon loss of control, significant influence or joint control of an entity. Additionally, the amendment provides guidance on the reclassification of accumulated foreign exchange differences to the income statement when a partial disposal of an interest in a foreign entity occurs. As a result of this new guidance, the Company no longer reclassifies accumulated foreign exchange differences from equity to the income statement upon settlement of intercompany loan balances when there is no change in the Company’s ownership interest in the subsidiary.
IFRS 3 (Revised), Business Combinations
Effective January 1, 2010, the Company adopted IFRS 3 (Revised), Business Combinations. Most significantly, the revised standard requires:
|
|
●
|
directly attributable transaction costs be expensed rather than included in the acquisition purchase price;
|
|
|
●
|
contingent consideration accounted for as a financial liability be measured at fair value on the acquisition date, with subsequent changes in the fair value recorded through the income statement; and
|
|
|
●
|
that upon gaining control in a step acquisition, an entity re-measures its existing ownership interest to fair value through the income statement.
|
During 2010, the Company expensed $26 million of directly attributable transaction costs related to various acquisitions and recorded an $18 million gain in connection with gaining control in a step acquisition. See note 28 for details of the Tradeweb transaction.
Principles of consolidation
The financial statements of the Company include the accounts of all of its subsidiaries.
Thomson Reuters Annual Report 2010
82
Subsidiaries
Subsidiaries are entities over which the Company has control, where control is defined as the power to govern financial and operating policies. Generally, the Company has a shareholding of more than 50% of the voting rights in its subsidiaries. The effect of potential voting rights that are currently exercisable are considered when assessing whether control exists. Subsidiaries are fully consolidated from the date control is transferred to the Company, and are de-consolidated from the date control ceases.
The acquisition method of accounting is used to account for the acquisition of subsidiaries as follows:
|
|
●
|
cost is measured as the fair value of the assets given, equity instruments issued and liabilities incurred or assumed at the date of exchange, excluding transaction costs which are expensed as incurred;
|
|
|
●
|
identifiable assets acquired and liabilities assumed are measured at their fair values at the acquisition date;
|
|
|
●
|
the excess of acquisition cost over the fair value of the identifiable net assets acquired is recorded as goodwill;
|
|
|
●
|
if the acquisition cost is less than the fair value of the net assets acquired, the fair value of the net assets is re-assessed and any remaining difference is recognized directly in the income statement;
|
|
|
●
|
contingent consideration is measured at fair value on the acquisition date, with subsequent changes in the fair value recorded through the income statement when the contingent consideration is a financial liability. Contingent consideration is not re-measured when it is an equity instrument. For acquisitions completed prior to January 1, 2010, subsequent changes in the fair value of contingent consideration are adjusted against goodwill; and
|
|
|
●
|
upon gaining control in a step acquisition, the existing ownership interest is re-measured to fair value through the income statement.
|
Intercompany transactions between subsidiaries are eliminated in consolidation. Transactions with non-controlling interests are treated as transactions with equity owners of the Company. For purchases from non-controlling interests, the difference between the consideration paid and the share of the carrying value of net assets acquired is recorded in equity. Gains or losses on disposals to non-controlling interests are similarly computed and also recorded in equity.
Equity method investees
Equity method investees are entities over which the Company has significant influence, but not control. Generally, the Company has a shareholding of between 20% and 50% of the voting rights in its equity method investees. Investments in equity method investees are accounted for using the equity method as follows:
|
|
●
|
investments are initially recognized at cost;
|
|
|
●
|
equity method investees include goodwill identified on acquisition, net of any accumulated impairment loss;
|
|
|
●
|
the Company’s share of post-acquisition profits or losses is recognized in the income statement and is adjusted against the carrying amount of the investments;
|
|
|
●
|
when the Company’s share of losses equals or exceeds its interest in the investee, including unsecured receivables, the Company does not recognize further losses, unless it has incurred obligations or made payments on behalf of the investee; and
|
|
|
●
|
gains on transactions between the Company and its equity method investees are eliminated to the extent of the Company’s interest in these entities, and losses are eliminated unless the transaction provides evidence of an impairment of the asset transferred.
|
Joint ventures
Joint ventures are entities over which the Company has joint control with one or more unaffiliated entities. Joint ventures are accounted for using the proportionate consolidation method as follows:
|
|
●
|
the statement of financial position includes the Company’s share of the assets that it controls jointly and the liabilities for which it is jointly responsible;
|
|
|
●
|
the income statement includes the Company’s share of the income and expenses of the jointly controlled entity; and
|
|
|
●
|
gains on transactions between the Company and its joint ventures are eliminated to the extent of the Company’s interest in the joint ventures and losses are eliminated, unless the transaction provides evidence of an impairment of the asset transferred.
|
The accounting policies of subsidiaries, equity method investees and joint ventures were changed where necessary to ensure consistency with the policies adopted by the Company.
Thomson Reuters Annual Report 2010
83
Operating segments
The Company’s operating segments are organized around the markets it serves and are reported in a manner consistent with the internal reporting provided to the chief operating decision-maker (“CODM”). The Chief Executive Officer has authority for resource allocation and assessment of the Company’s performance and is therefore the CODM.
Foreign currency
The consolidated financial statements are presented in U.S. dollars, which is the Company's presentation currency.
The financial statements of each of the Company's subsidiaries are measured using the currency of the primary economic environment in which the subsidiary operates (the "functional currency"). Foreign currency transactions are translated into the functional currency using the exchange rates prevailing at the dates of the transaction. Foreign exchange gains and losses resulting from the settlement of such transactions as well as from the translation of monetary assets and liabilities not denominated in the functional currency of the subsidiary, are recognized in the income statement, except for qualifying cash flow hedges which are deferred in accumulated other comprehensive income in shareholders’ equity.
Assets and liabilities of entities with functional currencies other than U.S. dollars are translated to U.S. dollars at the period end rates of exchange, and the results of their operations are translated at average rates of exchange for the period. The resulting translation adjustments are included in accumulated other comprehensive income in shareholders' equity. Additionally, foreign exchange gains and losses related to certain intercompany loans that are permanent in nature are included in accumulated other comprehensive income.
Foreign exchange gains and losses arising from the following are presented in the income statement within “finance costs, net”:
|
|
●
|
borrowings;
|
|
|
●
|
cash and cash equivalents;
|
|
|
●
|
intercompany loans that are not permanent in nature; and
|
|
|
●
|
settlement of intercompany loans previously considered permanent in nature upon loss of control, significant influence or joint control of the applicable entity.
|
All other foreign exchange gains and losses are presented in the income statement within “Operating expenses.”
References to “$” are to U.S. dollars, references to “C$” are to Canadian dollars, and references to “£” are to British pounds sterling.
Revenue recognition
Revenue is measured at the fair value of the consideration received or receivable, net of estimated returns and discounts, and after eliminating intercompany sales. The Company bases its estimates on historical results, taking into consideration the type of customer, the type of transaction and the specifics of each arrangement.
Revenue from the rendering of services is recognized when the following criteria are met:
|
|
●
|
the amount of revenue can be measured reliably;
|
|
|
●
|
the stage of completion can be measured reliably;
|
|
|
●
|
the receipt of economic benefits is probable; and
|
|
|
●
|
costs incurred and to be incurred can be measured reliably.
|
Revenue from the sale of goods is recognized when the following criteria are met:
|
|
●
|
the risks and rewards of ownership, including managerial involvement, have transferred to the buyer;
|
|
|
●
|
the amount of revenue can be measured reliably;
|
|
|
●
|
the receipt of economic benefits is probable; and
|
|
|
●
|
costs incurred or to be incurred can be measured reliably.
|
In addition to the above general principles, the Company applies the following specific revenue recognition policies:
Subscription-based products, including software term licenses
Subscription revenues from sales of products and services that are delivered under a contract over a period of time are recognized on a straight-line basis over the term of the subscription. Where applicable, usage fees above a base period fee are recognized as services are delivered. Subscription revenue received or receivable in advance of the delivery of services or publications is included in deferred revenue.
Thomson Reuters Annual Report 2010
84
Multiple component arrangements
When a single sales transaction requires the delivery of more than one product or service (multiple components), the revenue recognition criteria are applied to the separately identifiable components. A component is considered to be separately identifiable if the product or service delivered has stand-alone value to that customer and the fair value associated with the product or service can be measured reliably. The amount recognized as revenue for each component is the fair value of the element in relation to the fair value of the arrangement as a whole.
Installation or implementation services
Certain arrangements include installation or implementation services. Consulting revenues from these arrangements are accounted for separately from software or subscription revenue if the services have stand-alone value to that customer and the amount attributed to the services can be measured reliably. If the services do not qualify for separate accounting, they are recognized together with the related software or subscription revenue.
Sales involving third parties
Revenue from sales of third party vendor products or services is recorded net of costs when the Company is acting as an agent between the customer and vendor and recorded gross when the Company is a principal to the transaction.
Other service contracts
For service or consulting arrangements, revenues are recognized as services are performed, generally based on hours incurred relative to total hours expected to be incurred.
Employee future benefits
For defined benefit pension plans and other post-employment benefits, the net periodic pension expense is actuarially determined on an annual basis by independent actuaries using the projected unit credit method. The determination of benefit expense requires assumptions such as the expected return on assets available to fund pension obligations, the discount rate to measure obligations, expected mortality, the expected rate of future compensation and the expected healthcare cost trend rate. For the purpose of calculating the expected return on plan assets, the assets are valued at fair value. Actual results will differ from results which are estimated based on assumptions. The vested portion of past service cost arising from plan amendments is recognized immediately in the income statement. The unvested portion is amortized on a straight-line basis over the average remaining period until the benefits become vested.
The asset or liability recognized in the statement of financial position is the present value of the defined benefit obligation at the end of the reporting period less the fair value of plan assets, together with adjustments for unrecognized past service costs. The present value of the defined benefit obligation is determined by discounting the estimated future cash outflows using interest rates of high-quality corporate bonds that are denominated in the currency in which the benefits will be paid and that have terms to maturity approximating the terms of the related pension liability. All actuarial gains and losses that arise in calculating the present value of the defined benefit obligation and the fair value of plan assets are recognized immediately in retained earnings and included in the statement of comprehensive income. For funded plans, surpluses are recognized only to the extent that the surplus is considered recoverable. Recoverability is primarily based on the extent to which the Company can unilaterally reduce future contributions to the plan.
Payments to defined contribution plans are expensed as incurred, which is as the related employee service is rendered.
Share-based compensation plans
The Company operates a number of equity-settled and cash-settled share-based compensation plans under which it receives services from employees as consideration for equity instruments of the Company or cash payments.
For equity-settled share-based compensation, expense is based on the grant date fair value of the awards expected to vest over the vesting period. For cash-settled share-based compensation, the expense is determined based on the fair value of the liability at the end of the reporting period until the award is settled. The expense is recognized over the vesting period, which is the period over which all of the specified vesting conditions are satisfied. For awards with graded vesting, the fair value of each tranche is recognized over its respective vesting period. At the end of each reporting period, the Company re-assesses its estimates of the number of awards that are expected to vest and recognizes the impact of the revisions in the income statement.
Thomson Reuters Annual Report 2010
85
In 2010, the Company revised its accounting for withholding taxes on share-based compensation plans, which the Company settles from its own cash. Previously, the entire value of share-based awards related to time-based restricted share units (TRSUs), performance restricted share units (PRSUs) and stock options was accounted for as an equity-settled award. Accordingly, compensation expense was recognized over the vesting period based on the grant date fair value. Under the revised accounting, the portion of the award relating to withholding tax is treated as cash-settled, which results in a liability which is marked to market through the income statement each period. The Company assessed the materiality of this change and concluded that the revision was not material to the current period nor to any prior annual or interim period.
The cumulative effect of this change on the Company’s consolidated financial statements as at and for the year December 31, 2010 was as follows:
|
Increase
(Decrease
|
) | |||
|
Operating expenses
|
13 | (1) | ||
|
Net earnings
|
(7 | ) | ||
|
Equity
|
(89 | ) | ||
|
Total liabilities
|
96 | |||
(1) Comprised of an $18 million increase for fair value changes during 2010 and a $5 million decrease for periods prior to 2010.
Termination benefits
Termination benefits are generally payable when employment is terminated before the normal retirement date or whenever an employee accepts voluntary redundancy in exchange for these benefits. The Company recognizes termination benefits when it is demonstrably committed to either terminating the employment of current employees according to a detailed formal plan without realistic possibility of withdrawal or providing termination benefits as a result of an offer made to encourage voluntary redundancy.
Profit sharing and bonus plans
Liabilities for bonuses and profit-sharing are recognized based on a formula that takes into consideration the profit attributable to the Company’s shareholders after certain adjustments. The Company recognizes a provision where contractually obliged or where there is a past practice that has created a constructive obligation to make such compensation payments.
Cash and cash equivalents
Cash and cash equivalents comprise cash on hand, demand deposits and investments with an original maturity at the date of purchase of three months or less.
Trade receivables
Trade receivables are amounts due from customers from providing services or sale of goods in the ordinary course of business. Trade receivables are classified as current assets if payment is due within one year or less. Trade receivables are recognized initially at fair value and subsequently measured at amortized cost, less impairment.
The Company maintains an allowance for doubtful accounts and sales adjustments to provide for impairment of trade receivables. The expense relating to doubtful accounts is included within “Operating expenses” in the income statement. Revenues are recorded net of sales adjustments.
Computer hardware and other property
Computer hardware and other property are recorded at cost and depreciated on a straight-line basis over their estimated useful lives as follows:
|
Computer hardware
|
3-5 years
|
|
Buildings and building improvements
|
5-40 years
|
|
Furniture, fixtures and equipment
|
3-10 years
|
Residual values and useful lives are reviewed at the end of each reporting period and adjusted if appropriate.
Thomson Reuters Annual Report 2010
86
Intangible assets
Computer software
Certain costs incurred in connection with the development of software to be used internally or for providing services to customers are capitalized once a project has progressed beyond a conceptual, preliminary stage to that of application development. Development costs that are directly attributable to the design and testing of identifiable and unique software products controlled by the Company are recognized as intangible assets when the following criteria are met:
|
|
●
|
it is technically feasible to complete the software product so that it will be available for use;
|
|
|
●
|
management intends to complete the software product and use or sell it;
|
|
|
●
|
there is an ability to use or sell the software product;
|
|
|
●
|
it can be demonstrated how the software product will generate probable future economic benefits;
|
|
|
●
|
adequate technical, financial and other resources to complete the development and to use or sell the software product are available; and
|
|
|
●
|
the expenditure attributable to the software product during its development can be reliably measured.
|
Costs that qualify for capitalization include both internal and external costs, but are limited to those that are directly related to the specific project. The capitalized amounts, net of accumulated amortization, are included in “Computer software, net” in the statement of financial position. These costs are amortized over their expected useful lives, which range from 3 to 10 years. The amortization expense is included in “Amortization of computer software” in the income statement. Residual values and useful lives are reviewed at the end of each reporting period and adjusted if appropriate.
Goodwill
Goodwill represents the excess of the cost of an acquisition over the fair value of the Company’s share of the identifiable net assets of the acquired subsidiary or equity method investee at the date of acquisition. Goodwill is tested annually for impairment and carried at cost less accumulated impairment losses. Gains and losses on the disposal of an entity include the carrying amount of goodwill relating to the entity sold.
Other identifiable intangible assets
Upon acquisition, identifiable intangible assets are recorded at fair value and are carried at cost less accumulated amortization.
Identifiable intangible assets with finite lives are amortized on a straight-line basis over their estimated useful lives as follows:
|
Trade names
|
2-27 years
|
|
Customer relationships
|
2-40 years
|
|
Databases and content
|
2-30 years
|
|
Other
|
2-30 years
|
Residual values and useful lives are reviewed at the end of each reporting period and adjusted if appropriate.
Impairment
Impairments are recorded when the recoverable amount of assets are less than their carrying amounts. The recoverable amount is the higher of an asset’s fair value less cost to sell or its value in use. Impairment losses, other than those relating to goodwill, are evaluated for potential reversals when events or changes in circumstances warrant such consideration.
Intangible assets
The carrying values of all intangible assets are reviewed for impairment whenever events or changes in circumstances indicate that their carrying amounts may not be recoverable. Additionally, the carrying values of identifiable intangible assets with indefinite lives and goodwill are tested annually for impairment. Specifically:
|
|
●
|
Trade names with indefinite useful lives are subject to an annual impairment assessment. For purposes of impairment testing, the fair value of trade names is determined using an income approach, specifically the relief from royalties method.
|
|
|
●
|
For the purpose of impairment testing, goodwill is allocated to cash-generating units (“CGU”) based on the level at which management monitors it, which is not higher than an operating segment. Goodwill is allocated to those CGUs that are expected to benefit from the business combination in which the goodwill arose.
|
Thomson Reuters Annual Report 2010
87
Non-financial assets
The carrying values of non-financial assets with finite lives, such as computer hardware and software, are assessed for impairment whenever events or changes in circumstances indicate that their carrying amounts may not be recoverable. In addition, long-lived assets that are not amortized, such as equity investments, are subject to annual or more frequent impairment assessment. For the purposes of assessing impairment, assets are grouped at the lowest levels for which there are separately identifiable cash flows.
Disposal of long-lived assets and discontinued operations
Long-lived assets are classified as held for sale if the carrying amount will be recovered principally through a sale transaction rather than through continued use and such sale is considered highly probable. The criteria for classification as held for sale include a firm decision by management or the board of directors to dispose of a business or a group of selected assets and the expectation that such disposal will be completed within a 12 month period. Assets held for sale are measured at the lower of their carrying amounts or their fair value less costs to sell and are no longer depreciated. Assets held for sale are classified as discontinued operations if the operations and cash flows can be clearly distinguished, operationally and for financial reporting purposes from the rest of the Company and they:
|
|
●
|
represent a separate major line of business or geographical area of operations;
|
|
|
●
|
are part of a single coordinated plan to dispose of a separate major line of business or geographical area of operations; or
|
|
|
●
|
are a subsidiary acquired exclusively with a view to resale.
|
Trade payables
Trade payables are obligations to pay for goods or services that have been acquired in the ordinary course of business. Trade payables are recognized initially at fair value and subsequently measured at amortized cost, and are classified as current liabilities if payment is due within one year or less.
Provisions
Provisions represent liabilities to the Company for which the amount or timing is uncertain. Provisions are recognized when the Company has a present legal or constructive obligation as a result of past events, it is probable that an outflow of resources will be required to settle the obligation, and the amount can be reliably estimated. Provisions are not recognized for future operating losses. Provisions are measured at the present value of the expected expenditures to settle the obligation using a discount rate that reflects current market assessments of the time value of money and the risks specific to the obligation. The increase in the provision due to passage of time is recognized as interest expense.
Indebtedness
Debt is recognized initially at fair value, net of transaction costs incurred. Debt is subsequently stated at amortized cost with any difference between the proceeds (net of transactions costs) and the redemption value recognized in the income statement over the term of the debt using the effective interest method. Where a debt instrument is in a fair value hedging relationship, a fair value adjustment is made to its carrying value to reflect hedged risk. Interest on indebtedness is expensed as incurred unless capitalized for qualifying assets in accordance with IAS 23, Borrowing Costs.
Debt is classified as a current liability unless the Company has an unconditional right to defer settlement for at least 12 months after the end of the reporting period.
Leases
Leases are classified as either operating or finance, based on the substance of the transaction at inception of the lease. Classification is re-assessed if the terms of the lease are changed.
Operating lease
Leases in which a significant portion of the risks and rewards of ownership are retained by the lessor are classified as operating leases. Payments under an operating lease (net of any incentives received from the lessor) are recognized in the income statement on a straight-line basis over the period of the lease.
Thomson Reuters Annual Report 2010
88
Finance lease
Leases in which substantially all the risks and rewards of ownership are transferred to the Company are classified as finance leases. Assets meeting finance lease criteria are capitalized at the lower of the present value of the related lease payments or the fair value of the leased asset at the inception of the lease. Minimum lease payments are apportioned between the finance charge and the liability. The finance charge is allocated to each period during the lease term so as to produce a constant periodic rate of interest on the remaining balance of the liability.
Financial assets
Purchases and sales of financial assets are recognized on the settlement date, which is the date on which the asset is delivered to or by the Company. Financial assets are derecognized when the rights to receive cash flows from the investments have expired or were transferred and the Company has transferred substantially all risks and rewards of ownership. Financial assets are classified in the following categories at the time of initial recognition based on the purpose for which the financial assets were acquired:
Financial assets at fair value through the income statement
|
|
●
|
Classification
|
Financial assets are classified as fair value through the income statement if acquired principally for the purpose of selling in the short-term, such as financial assets held for trading, or if so designated by management. Assets in this category principally include embedded derivatives and derivatives which do not qualify for hedge accounting.
|
|
●
|
Recognition and measurement
|
Financial assets carried at fair value through the income statement are initially recognized, and subsequently carried, at fair value, with changes recognized in the income statement. Transaction costs are expensed.
Loans and receivables
|
|
●
|
Classification
|
Loans and receivables are non-derivative financial assets with fixed or determinable payments that are not quoted in an active market. They are included in current assets, except for those with maturities greater than 12 months after the end of the reporting period, which are classified as non-current assets. Assets in this category include “trade and other receivables” and “cash and cash equivalents” and are classified as current assets in the statement of financial position.
|
|
●
|
Recognition and measurement
|
Loans and receivables are initially recognized at fair value plus transaction costs and subsequently carried at amortized cost using the effective interest method.
Available-for-sale financial assets
|
|
●
|
Classification
|
Available-for-sale financial assets are non-derivatives that are either designated in this category or not classified in any of the other categories. They are included in other non-current financial assets unless management intends to dispose of the investment within 12 months of the end of the reporting period. Included within this category are investments in entities over which the Company does not have control, joint control or significant influence.
|
|
●
|
Recognition and measurement
|
Investments are initially recognized at fair value plus transaction costs and are subsequently carried at fair value with changes recognized in other comprehensive income. Upon sale or impairment, the accumulated fair value adjustments recognized in other comprehensive income are included in the income statement.
Impairment of financial assets
At the end of each reporting period, the Company assesses whether there is objective evidence that a financial asset is impaired. Impairments are measured as the excess of the carrying amount over the fair value and are recognized in the income statement.
Thomson Reuters Annual Report 2010
89
Derivative financial instruments and hedging
Derivatives are initially recognized at fair value on the date a contract is entered into and are subsequently re-measured at their fair value. The method of recognizing the resulting gain or loss depends on whether the derivative is designated as a hedging instrument and the nature of the item being hedged.
The Company documents at the inception of the transaction the relationship between hedging instruments and hedged items, as well as its risk management objectives and strategy for undertaking various hedging transactions. The Company also documents its assessment, both at hedge inception and on an ongoing basis, of whether the derivatives that are used in hedging transactions are highly effective in offsetting changes in fair values or cash flows of hedged items.
Non-performance risk, including the Company’s own credit risk, is considered when determining the fair value of financial instruments.
The Company designates certain derivatives as either:
|
|
●
|
Fair value hedges
|
These are hedges of the fair value of recognized assets, liabilities or a firm commitment. Changes in the fair value of derivatives that are designated as fair value hedges are recorded in the income statement together with any changes in the fair value of the hedged asset or liability that are attributable to the hedged risk.
|
|
●
|
Cash flow hedges
|
These are hedges of highly probable forecast transactions. The effective portion of changes in the fair value of derivatives that are designated as a cash flow hedge is recognized in other comprehensive income. The gain or loss relating to the ineffective portion is recognized immediately in the income statement. Additionally:
|
|
●
|
amounts accumulated in other comprehensive income are recycled to the income statement in the period when the hedged item will affect profit and loss (for instance, when the forecast sale that is hedged takes place);
|
|
|
●
|
when a hedging instrument expires or is sold, or when a hedge no longer meets the criteria for hedge accounting, any cumulative gain or loss in other comprehensive income remains in other comprehensive income and is recognized when the forecast transaction is ultimately recognized in the income statement; and
|
|
|
●
|
when a forecast transaction is no longer expected to occur, the cumulative gain or loss that was reported in other comprehensive income is immediately recognized in the income statement.
|
Derivatives that do not qualify for hedge accounting
Certain derivative instruments, while providing effective economic hedges, are not designated as hedges for accounting purposes. Changes in the fair value of any derivatives that are not designated as hedges for accounting purposes are recognized within “Other finance costs” (see note 7) or “Operating expenses” (see note 5) in the income statement consistent with the underlying nature and purpose of the derivative instruments.
Embedded derivatives
An embedded derivative is a feature within a contract, where the cash flows associated with that feature behave in a similar fashion to a stand-alone derivative. The Company has embedded foreign currency derivatives in certain revenue and purchase contracts where the currency of the contract is different from the functional or local currencies of the parties involved. These derivatives are accounted for as separate instruments and are measured at fair value at the end of the reporting period using forward exchange market rates. Changes in their fair values are recognized within “Operating expenses” in the income statement.
Taxation
Tax expense comprises current and deferred tax. Tax is recognized in the income statement except to the extent it relates to items recognized in other comprehensive income or directly in equity.
Current tax
Current tax expense is based on the results for the period as adjusted for items that are not taxable or not deductible. Current tax is calculated using tax rates and laws that were enacted or substantively enacted at the end of the reporting period. Management periodically evaluates positions taken in tax returns with respect to situations in which applicable tax regulation is subject to interpretation. Provisions are established where appropriate on the basis of amounts expected to be paid to the tax authorities.
Thomson Reuters Annual Report 2010
90
Deferred tax
Deferred tax is recognized, using the liability method, on temporary differences arising between the tax bases of assets and liabilities and their carrying amounts in the statement of financial position. Deferred tax is calculated using tax rates and laws that have been enacted or substantively enacted at the end of the reporting period, and which are expected to apply when the related deferred income tax asset is realized or the deferred income tax liability is settled.
Deferred tax liabilities:
|
|
●
|
are generally recognized for all taxable temporary differences;
|
|
|
●
|
are recognized for taxable temporary differences arising on investments in subsidiaries, associates and joint ventures, except where the reversal of the temporary difference can be controlled and it is probable that the difference will not reverse in the foreseeable future; and
|
|
|
●
|
are not recognized on temporary differences that arise from goodwill which is not deductible for tax purposes.
|
Deferred tax assets:
|
|
●
|
are recognized to the extent it is probable that taxable profits will be available against which the deductible temporary differences can be utilized; and
|
|
|
●
|
are reviewed at the end of the reporting period and reduced to the extent that it is no longer probable that sufficient taxable profits will be available to allow all or part of the asset to be recovered.
|
Deferred tax assets and liabilities are not recognized in respect of temporary differences that arise on initial recognition of assets and liabilities acquired other than in a business combination.
NOTE 2: CRITICAL ACCOUNTING ESTIMATES AND JUDGMENTS
The preparation of financial statements requires management to make estimates and judgments about the future. Estimates and judgments are continually evaluated and are based on historical experience and other factors, including expectations of future events that are believed to be reasonable under the circumstances. Accounting estimates will, by definition, seldom equal the actual results. The following discussion sets forth management’s:
|
|
●
|
most critical estimates and assumptions in determining the value of assets and liabilities; and
|
|
|
●
|
most critical judgments in applying accounting policies.
|
Critical accounting estimates and assumptions
Allowance for doubtful accounts and sales adjustments
The Company must make an assessment of whether accounts receivable are collectible from customers. Accordingly, management establishes an allowance for estimated losses arising from non-payment and other sales adjustments, taking into consideration customer creditworthiness, current economic trends and past experience. If future collections differ from estimates, future earnings would be affected. At December 31, 2010, the combined allowances were $134 million, or 7%, of the gross trade accounts receivable balance of approximately $1.9 billion. An increase to the reserve based on 1% of accounts receivable would have decreased pre-tax earnings by approximately $19 million for the year ended December 31, 2010.
Computer software
Computer software represented approximately $1.6 billion of total assets on the consolidated statement of financial position at December 31, 2010. A significant portion of ongoing expenditures relate to software that is developed as part of electronic databases, delivery systems and internal infrastructures, and, to a lesser extent, software sold directly to customers. As part of the software development process, management must estimate the expected period of benefit over which capitalized costs should be amortized. The considerations which form the basis of the assumptions for these estimated useful lives include the timing of technological obsolescence and competitive pressures, as well as historical experience and internal business plans for the projected use of the software. Due to rapidly changing technology and the uncertainty of the software development process itself, future results could be affected if management’s current assessment of its software projects differs from actual performance.
Thomson Reuters Annual Report 2010
91
Other identifiable intangible assets and goodwill
Other identifiable intangible assets and goodwill represented approximately $27.6 billion of total assets on the consolidated statement of financial position at December 31, 2010. These assets arise out of business combinations. In 2010, the Company spent $612 million in net cash consideration on acquisitions. Additionally, acquisitions included an exchange of equity interests involving the Company’s Tradeweb business (see note 28). These transactions were accounted for under the acquisition method of accounting, which involves the allocation of the cost of an acquisition to the underlying net assets acquired based on their respective estimated fair values. As part of this allocation process, the Company must identify and attribute values and estimated lives to the intangible assets acquired. These determinations involve significant estimates and assumptions regarding cash flow projections, economic risk and weighted cost of capital.
These estimates and assumptions determine the amount allocated to other identifiable intangible assets and goodwill, as well as the amortization period for identifiable intangible assets with finite lives. If future events or results differ adversely from these estimates and assumptions, the Company could record increased amortization or impairment charges in the future.
See note 18 for a discussion of the annual impairment testing of goodwill.
Employee future benefits
The Company sponsors defined benefit plans providing pension and other post-employment benefits to covered employees. The determination of expense and obligations associated with employee future benefits requires the use of assumptions such as the expected return on assets available to fund pension obligations, the discount rate to measure obligations, the expected mortality, the expected rate of future compensation and the expected healthcare cost trend rate. Because the determination of the cost and obligations associated with employee future benefits requires the use of various assumptions, there is measurement uncertainty inherent in the actuarial valuation process. Actual results will differ from results which are estimated based on assumptions.
See note 26 for further details including an estimate of the impact on the financial statements from changes in the most critical assumptions.
Income taxes
The Company computes an income tax provision in each of the jurisdictions in which it operates. However, actual amounts of income tax expense only become final upon filing and acceptance of the tax return by the relevant authorities, which occur subsequent to the issuance of the financial statements. Additionally, estimation of income taxes includes evaluating the recoverability of deferred tax assets based on an assessment of the ability to use the underlying future tax deductions before they expire against future taxable income. The assessment is based upon existing tax laws and estimates of future taxable income. To the extent estimates differ from the final tax return, earnings would be affected in a subsequent period.
In interim periods, the income tax provision is based on estimates of full-year earnings by jurisdiction. The average annual effective income tax rates are re-estimated at each interim reporting date. To the extent that forecasts differ from actual results, adjustments are recorded in subsequent periods.
The Company’s 2010 effective tax rate was 13% of earnings from continuing operations before tax. A 1% increase in the effective tax rate would have increased 2010 income tax expense by approximately $11 million.
Critical judgments in applying accounting policies
Revenue recognition
As described in note 1, the Company assesses the criteria for the recognition of revenue related to arrangements that have multiple components. These assessments require judgment by management to determine if there are separately identifiable components as well as how to allocate the total price among the components. Deliverables are accounted for as separately identifiable components if they can be understood without reference to the series of transactions as a whole. In concluding whether components are separately identifiable, management considers the transaction from the customer’s perspective. Among other factors, management assesses whether the service or good is sold separately by the Company in the normal course of business or whether the customer could purchase the service or good separately. With respect to the allocation of price among components, management uses its judgment to assign a fair value to each component. As evidence of fair value, management looks to such items as the price for the component when sold separately, renewal rates for specific components and prices for a similar product sold separately.
Thomson Reuters Annual Report 2010
92
Uncertain tax positions
The Company is subject to taxation in numerous jurisdictions. There are many transactions and calculations during the course of business for which the ultimate tax determination is uncertain. The Company maintains provisions for uncertain tax positions that it believes appropriately reflect its risk. These provisions are made using the best estimate of the amount expected to be paid based on a qualitative assessment of all relevant factors. The Company reviews the adequacy of these provisions at the end of the reporting period. However, it is possible that at some future date, liabilities in excess of the Company’s provisions could result from audits by, or litigation with, the IRS or other relevant taxing authorities. Where the final outcome of these tax-related matters is different from the amounts that were initially recorded, such differences will affect the tax provisions in the period in which such determination is made.
NOTE 3: RECENT ACCOUNTING PRONOUNCEMENTS
Certain new standards, interpretations, amendments and improvements to existing standards were issued by the IASB or International Financial Reporting Interpretations Committee (“IFRIC”) that are mandatory for accounting periods beginning January 1, 2011 or later periods. The standards impacted that are applicable to the Company are as follows:
|
|
●
|
IFRS 3 - Business Combinations;
|
|
|
●
|
IFRS 7 - Financial Instruments: Disclosures;
|
|
|
●
|
IAS 1 - Presentation of Financial Statements;
|
|
|
●
|
IAS 24 - Related Party Disclosures;
|
|
|
●
|
IAS 27 - Consolidated and Separate Financial Statements; and
|
|
|
●
|
IAS 34 - Interim Financial Reporting.
|
The Company does not anticipate that any of these changes will have a material impact on its results of operations or financial position.
In addition to the above, the IASB has issued IFRS 9 - Financial Instruments (Classification and Measurement), which is mandatory for accounting periods beginning January 1, 2013. The Company is assessing the impact of IFRS 9 on its results of operations and financial position.
NOTE 4: SEGMENT INFORMATION
The Company is organized in two divisions: Markets, which consists of financial and media businesses, and Professional, which is comprised of the Legal, Tax & Accounting, and Healthcare & Science segments. The reportable segments are strategic business groups that offer products and services to target markets, as described below. The accounting policies applied by the segments are the same as those applied by the Company.
Legal
The Legal segment is a provider of critical information, decision support tools, software and services to legal, intellectual property, compliance, business and government professionals around the world. The Legal segment offers a broad range of products and services that utilize the Company’s electronic databases of legal, regulatory, news and business information. These products and services provide software-based workflow solutions; marketing, finance and operations technology and consulting services; and legal process outsourcing services.
Tax & Accounting
Tax & Accounting segment is a global provider of technology and information solutions, as well as integrated tax compliance and accounting software and services, to accounting, tax and corporate finance professionals in accounting firms, corporations, law firms and government.
Healthcare & Science
The Healthcare & Science segment is a provider of information, tools, analytics and decision support solutions that help organizations speed scientific discovery and improve healthcare efficiency and quality.
Thomson Reuters Annual Report 2010
93
Markets
The Markets division serves financial services and corporate professionals globally, with Reuters Media serving a broader professional and consumer media market. The Markets division delivers critical information, supporting technology and infrastructure to a diverse set of customers. These solutions are designed to help the Company’s customers generate superior returns, improve risk management, increase access to liquidity and create efficient, reliable infrastructures in increasingly global, electronic and multi-asset class markets.
|
Reportable Segments - 2010
|
||||||||||||||||||||
|
Revenues
|
Depreciation and amortization of computer software
|
Segment operating profit
|
Additions to capital assets(1) and goodwill
|
Total
assets
|
||||||||||||||||
|
Legal
|
3,677
|
288
|
1,058
|
900
|
7,400
|
|||||||||||||||
|
Tax & Accounting
|
1,079
|
96
|
216
|
103
|
1,888
|
|||||||||||||||
|
Healthcare & Science
|
882
|
67
|
198
|
106
|
1,537
|
|||||||||||||||
|
Professional
|
5,638
|
451
|
1,472
|
1,109
|
10,825
|
|||||||||||||||
|
Markets
|
7,441
|
553
|
1,337
|
1,322
|
22,511
|
|||||||||||||||
|
Segment totals
|
13,079
|
1,004
|
2,809
|
2,431
|
33,336
|
|||||||||||||||
|
Corporate & Other (2)
|
-
|
25
|
(829)
|
14
|
2,195
|
|||||||||||||||
|
Eliminations
|
(9)
|
-
|
-
|
-
|
-
|
|||||||||||||||
|
Total
|
13,070
|
1,029
|
1,980
|
2,445
|
35,531
|
|||||||||||||||
|
Reportable Segments - 2009
|
||||||||||||||||||||
|
Revenues
|
Depreciation and amortization of computer software
|
Segment operating profit
|
Additions to capital assets(1) and goodwill
|
Total
assets
|
||||||||||||||||
|
Legal
|
3,586
|
262
|
1,155
|
356
|
6,820
|
|||||||||||||||
|
Tax & Accounting
|
1,006
|
78
|
214
|
276
|
1,900
|
|||||||||||||||
|
Healthcare & Science
|
878
|
71
|
172
|
129
|
1,565
|
|||||||||||||||
|
Professional
|
5,470
|
411
|
1,541
|
761
|
10,285
|
|||||||||||||||
|
Markets
|
7,535
|
619
|
1,453
|
726
|
22,010
|
|||||||||||||||
|
Segment totals
|
13,005
|
1,030
|
2,994
|
1,487
|
32,295
|
|||||||||||||||
|
Corporate & Other (2)
|
-
|
27
|
(929)
|
19
|
2,278
|
|||||||||||||||
|
Eliminations
|
(8)
|
-
|
-
|
-
|
-
|
|||||||||||||||
|
Total
|
12,997
|
1,057
|
2,065
|
1,506
|
34,573
|
|||||||||||||||
|
Geographic Information - 2010
|
||||||||
|
(by country of origin)
|
Revenues
|
Non-current assets(3)
|
||||||
|
Americas (North America, Latin America, South America)
|
7,754
|
18,754
|
||||||
|
EMEA (Europe, Middle East and Africa)
|
3,845
|
9,676
|
||||||
|
Asia Pacific
|
1,471
|
2,615
|
||||||
|
Total
|
13,070
|
31,045
|
||||||
|
Geographic Information - 2009
|
||||||||
|
(by country of origin)
|
Revenues
|
Non-current assets(3)
|
||||||
|
Americas (North America, Latin America, South America)
|
7,699
|
18,239
|
||||||
|
EMEA (Europe, Middle East and Africa)
|
3,948
|
9,512
|
||||||
|
Asia Pacific
|
1,350
|
2,428
|
||||||
|
Total
|
12,997
|
30,179
|
||||||
|
(1)
|
Capital assets include computer hardware and other property, computer software and other identifiable intangible assets.
|
|
(2)
|
Corporate & Other operating profit includes corporate expenses, certain share-based compensation costs, certain fair value adjustments and integration programs expenses.
|
|
(3)
|
Non-current assets are primarily comprised of computer hardware and other property, computer software, other identifiable intangible assets, goodwill and investments in equity method investees.
|
Thomson Reuters Annual Report 2010
94
In accordance with IFRS 8, Operating Segments, the Company discloses information about its reportable segments based upon the measures used by management in assessing the performance of those reportable segments. The Company uses segment operating profit to measure the operating performance of its segments. The costs of centralized support services such as technology, accounting, procurement, legal, human resources and strategy are allocated to each segment based on usage or other applicable measures. Segment operating profit is defined as operating profit before (i) amortization of other identifiable intangible assets; (ii) other operating gains and losses; and (iii) certain asset impairment charges. Management uses this measure because amortization of other identifiable intangible assets, other operating gains and losses and certain asset impairment charges are not considered to be controllable operating activities for purposes of assessing the current performance of the segments. While in accordance with IFRS, the Company’s definition of segment operating profit may not be comparable to that of other companies.
The following table reconciles segment operating profit per the reportable segment information to operating profit per the consolidated income statement. Amounts below operating profit are not allocated to the segments.
|
Year ended December 31,
|
||||||||
|
2010
|
2009
|
|||||||
|
Segment operating profit
|
1,980
|
2,065
|
||||||
|
Amortization of other identifiable intangible assets
|
(545)
|
(499)
|
||||||
|
Other operating (losses) gains, net
|
(16)
|
9
|
||||||
|
Operating profit
|
1,419
|
1,575
|
||||||
Revenue by Classes of Similar Products or Services
The following table sets forth revenues by major type:
|
Year ended December 31,
|
||||||||
|
2010
|
2009
|
|||||||
|
Electronic, software & services
|
11,836
|
11,718
|
||||||
|
Print / CD
|
1,234
|
1,279
|
||||||
|
Total
|
13,070
|
12,997
|
||||||
NOTE 5: OPERATING EXPENSES
The components of operating expenses include the following:
|
Year ended December 31,
|
||||||||
|
2010
|
2009
|
|||||||
|
Salaries, commission and allowances
|
4,864
|
4,668
|
||||||
|
Share-based payments
|
92
|
105
|
||||||
|
Post-employment benefits
|
217
|
209
|
||||||
|
Total staff costs
|
5,173
|
4,982
|
||||||
|
Goods and services (1)
|
2,637
|
2,567
|
||||||
|
Data
|
1,006
|
1,047
|
||||||
|
Telecommunications
|
635
|
634
|
||||||
|
Real estate
|
493
|
475
|
||||||
|
Fair value adjustments (2)
|
117
|
170
|
||||||
|
Total operating expenses
|
10,061
|
9,875
|
||||||
|
(1)
|
Goods and services include professional fees, consulting services, contractors, technology-related expenses, selling and marketing, and other general and administrative costs.
|
|
(2)
|
Fair value adjustments primarily relate to embedded derivatives.
|
In 2008, the Company announced an integration program directed at integrating Reuters Group PLC (“Reuters”), which the Company acquired in April 2008, with the Thomson Financial business and capturing cost synergies across the new organization, including shared services and corporate functions. The Company also incurred expenses for legacy savings programs pursued prior to the acquisition. Because these are corporate initiatives, incremental expenses directed at capturing cost savings are reported within the Corporate & Other segment. The various initiatives are expected to be completed in 2011. The Company will incur restructuring costs, including severance and losses on lease terminations and other cancellations of contracts, until the various initiatives are completed.
Costs incurred for integration programs were as follows:
|
Year ended December 31,
|
||||||||
|
2010
|
2009
|
|||||||
|
Integration programs expenses
|
463
|
506
|
||||||
Thomson Reuters Annual Report 2010
95
The costs incurred primarily related to severance, consulting expenses and technology initiatives, as well as branding expense in 2009. Severance costs were included within the “Salaries, commissions and allowances” component of “Operating expenses”. Consulting, branding and technology-related expenses were included within the “Goods and services” component of “Operating expenses”. See note 22.
NOTE 6: OTHER OPERATING (LOSSES) GAINS, NET
In 2010, other operating losses, net of $16 million were primarily comprised of a settlement in connection with a vendor dispute and acquisition-related expenses, which were partially offset by gains from the sale of certain investments and a gain from re-measuring the investment in Tradeweb New Markets. See note 28.
In 2009, other operating gains, net, of $9 million were primarily comprised of a $30 million gain on the sale of a wholly owned subsidiary to a company affiliated with Woodbridge (see note 30), partially offset by losses associated with businesses that were sold.
NOTE 7: FINANCE COSTS, NET
The components of finance costs, net, include interest (expense) income and other finance (costs) income as follows:
|
Year ended December 31,
|
||||||||
|
2010
|
2009
|
|||||||
|
Interest expense:
|
||||||||
|
Debt
|
(433
|
)
|
(456
|
)
|
||||
|
Derivative financial instruments - hedging activities
|
52
|
46
|
||||||
|
Other
|
(25
|
)
|
(22
|
)
|
||||
|
Fair value gains (losses) on financial instruments:
|
||||||||
|
Debt
|
30
|
19
|
||||||
|
Cash flow hedges, transfer from equity (see note 19)
|
123
|
340
|
||||||
|
Fair value hedges (see note 19)
|
(31
|
)
|
108
|
|||||
|
Net foreign exchange losses on debt
|
(122
|
)
|
(467
|
)
|
||||
|
(406
|
)
|
(432
|
)
|
|||||
|
Interest income
|
23
|
22
|
||||||
|
Net interest expense
|
(383
|
)
|
(410
|
)
|
||||
|
Year ended December 31,
|
||||||||
|
2010
|
2009
|
|||||||
|
Net gains (losses) due to changes in foreign currency exchange rates
|
89
|
(188
|
) | |||||
|
Net losses on derivative instruments
|
(9
|
) |
(18
|
) | ||||
|
Losses from redemption of debt securities
|
(62
|
) |
(35
|
) | ||||
|
Other
|
10
|
(1
|
) | |||||
|
Other finance income (costs)
|
28
|
(242
|
) | |||||
Net gains (losses) due to changes in foreign currency exchange rates
Net gains (losses) due to changes in foreign currency exchange rates were principally comprised of amounts related to certain intercompany funding arrangements.
Net losses on derivative instruments
Net losses on derivative instruments were principally comprised of amounts related to freestanding derivatives instruments.
Losses from redemption of debt securities
These amounts represent losses incurred in connection with the early redemption of debt securities announced in March 2010 and September 2009. The losses primarily represent premiums paid for early extinguishment. The 2009 amount is also net of a gain recycled from equity for related derivatives previously designated as cash flow hedges. See note 19.
NOTE 8: OTHER NON-OPERATING CHARGE
In conjunction with the recognition of tax losses acquired in a business combination, the Company recorded a $385 million reduction to goodwill in 2009. The reduction to goodwill was recorded as an expense below operating profit because the accounting adjustment was not reflective of the Company’s core operating results.
Thomson Reuters Annual Report 2010
96
NOTE 9: TAXATION
The components of tax expense (benefit) for 2010 and 2009 were as follows:
|
Year ended December 31,
|
||||||||
|
2010
|
2009
|
|||||||
|
Current tax expense:
|
||||||||
|
Continuing operations
|
344
|
245
|
||||||
|
Discontinued operations
|
-
|
4
|
||||||
|
Deferred tax expense (benefit):
|
||||||||
|
Continuing operations
|
(205
|
) |
(544
|
) | ||||
|
Discontinued operations
|
-
|
4
|
||||||
|
Total tax expense (benefit):
|
||||||||
|
Continuing operations
|
139
|
(299
|
) | |||||
|
Discontinued operations
|
-
|
8
|
||||||
Taxes on items recognized in other comprehensive income or directly in equity in 2010 and 2009 were as follows:
|
Year ended December 31,
|
||||||||
|
2010
|
2009
|
|||||||
|
Deferred tax benefit on actuarial losses on defined benefit plans
|
(58
|
) |
(7
|
) | ||||
|
Deferred tax benefit on share based payments
|
(9
|
) |
(4
|
) | ||||
Factors affecting tax expense (benefit) for the year
The standard rate of Canadian corporate income tax for 2010 was 30.5%. The following is a reconciliation of income taxes calculated at the Canadian corporate tax rate to the tax expense (benefit) for 2010 and 2009:
|
Year ended December 31,
|
||||||||
|
2010
|
2009
|
|||||||
|
Income before tax
|
1,072
|
545
|
||||||
|
Income before tax multiplied by the standard rate of Canadian corporate tax of 30.5% (2009 - 32.3%)
|
327
|
176
|
||||||
|
Effects of:
|
||||||||
|
Income taxes recorded at rates different from the Canadian tax rate (1)
|
(355
|
)
|
(313
|
)
|
||||
|
Tax losses for which no benefit is recognized (1)
|
108
|
170
|
||||||
|
Impact of asset transfer between affiliates (2)
|
-
|
(496
|
)
|
|||||
|
Impairments of non-deductible goodwill (3)
|
-
|
124
|
||||||
|
Net (non-taxable) non deductible foreign exchange and other (gains) losses
|
(11
|
)
|
44
|
|||||
|
Withholding taxes
|
39
|
26
|
||||||
|
Recognition of tax losses that arose in prior years
|
(20
|
)
|
(59
|
)
|
||||
|
Other adjustments related to prior years (4)
|
(38
|
)
|
(47
|
)
|
||||
|
Impact of tax law changes
|
(15
|
)
|
(12
|
)
|
||||
|
Provision for uncertain tax positions
|
89
|
79
|
||||||
|
Other differences (1)
|
15
|
9
|
||||||
|
Total tax expense (benefit) on continuing operations
|
139
|
(299
|
)
|
|||||
|
(1)
|
2009 amounts have been presented on a comparable basis to 2010.
|
|
(2)
|
In December 2009, the Company completed an intercompany sale of an asset on which a deferred tax liability of $496 million had been established upon the acquisition of a business. The intercompany sale was completed in a tax free manner and the deferred tax liability was released upon completion. There was no cash impact from this transaction.
|
|
(3)
|
Relates primarily to non-deductible impairments of goodwill required under IFRS 3 in conjunction with the recognition of deferred tax assets for acquired tax losses.
|
|
(4)
|
In 2009, amount includes $35 million for intercompany interest payments not previously considered to be deductible.
|
Thomson Reuters Annual Report 2010
97
The effective income tax rates on earnings from continuing operations of 13% in 2010 and a benefit of 54.9% in 2009 were lower than the Canadian corporate income tax rate due principally to the lower tax rates and differing tax rules applicable to certain of the Company’s operating and financing subsidiaries outside Canada. Specifically, while the Company generates revenues in numerous jurisdictions, the tax provision on earnings is computed after taking account of intercompany interest and other charges and credits among subsidiaries resulting from their capital structure as well as from the various jurisdictions in which operations, technology and content assets are owned. For these reasons, the effective tax rate differs substantially from the Canadian corporate tax rate. The effective income tax rate on earnings in 2009 was also significantly impacted by the tax implications from the sale of an intercompany asset, as described above. The Company’s effective tax rate and its cash tax cost depend on the laws of numerous countries and the provisions of multiple income tax conventions between various countries in which the Company operates.
At December 31, 2010, the consolidated statement of financial position included current taxes receivable of $176 million (2009 - $140 million) within “Prepaid expenses and other current assets” and current taxes payable of $71 million (2009 - $63 million) within “Payables, accruals and provisions”.
NOTE 10: DISCONTINUED OPERATIONS
The 2009 results for discontinued operations represent certain adjustments made in conjunction with the expiration of past representations and warranty periods or the refinement of earlier estimates related to the disposal of the Thomson Learning business unit in 2007.
“Investing cash flows from discontinued operations” within the statement of cash flow for the year ending December 31, 2009 primarily represented cash exchanged for certain working capital adjustments.
NOTE 11: EARNINGS PER SHARE
Basic earnings per share was calculated by dividing earnings attributable to common shares less dividends declared on preference shares by the sum of the weighted-average number of shares outstanding during the period plus vested deferred share units (“DSUs”) and vested equity-based performance restricted share units (“PRSUs”). DSUs represent common shares certain employees have elected to receive in the future in lieu of cash compensation.
Diluted earnings per share was calculated using the denominator of the basic calculation described above adjusted to include the potentially dilutive effect of outstanding stock options and other securities. The denominator is: (1) increased by the total number of additional common shares that would have been issued by the Company assuming exercise of all stock options with exercise prices below the average market price for the period; and (2) decreased by the number of shares that the Company could have repurchased if it had used the assumed proceeds from the exercise of stock options to repurchase them on the open market at the average share price for the year. Other securities are comprised of unvested TRSUs.
Earnings used in determining consolidated earnings per share and earnings per share from continuing operations are consolidated net earnings reduced by (1) earnings attributable to non-controlling interests and (2) dividends declared on preference shares as presented below:
|
Year ended December 31,
|
||||||||
|
2010
|
2009
|
|||||||
|
Net earnings
|
933
|
867
|
||||||
|
Less: Earnings attributable to non-controlling interests
|
(24
|
) |
(23
|
) | ||||
|
Dividends declared on preference shares
|
(3
|
) |
(2
|
) | ||||
|
Earnings used in consolidated earnings per share
|
906
|
842
|
||||||
|
Less: Earnings from discontinued operations, net of tax
|
-
|
(23
|
) | |||||
|
Earnings used in earnings per share from continuing operations
|
906
|
819
|
||||||
Earnings used in determining earnings per share from discontinued operations are the earnings from discontinued operations as reported within the income statement.
Thomson Reuters Annual Report 2010
98
The weighted-average number of shares outstanding, as well as a reconciliation of the weighted-average number of shares outstanding used in the basic earnings per share computation to the weighted-average number of shares outstanding used in the diluted earnings per share computation, is presented below:
|
Year ended December 31,
|
||||||||
|
2010
|
2009 (1)
|
|||||||
|
Weighted average number of shares outstanding
|
831,396,928
|
828,708,909
|
||||||
|
Vested DSUs and PRSUs
|
910,777
|
1,289,998
|
||||||
|
Basic
|
832,307,705
|
829,998,907
|
||||||
|
Effect of stock and other incentive plans
|
4,139,709
|
2,943,431
|
||||||
|
Diluted
|
836,447,414
|
832,942,338
|
||||||
|
(1)
|
The Company’s 2009 unification of its dual listed company (“DLC”) structure had no impact on the number of shares outstanding, as Thomson Reuters PLC ordinary shares and Thomson Reuters PLC American Depositary Shares were exchanged for an equivalent number of common shares of the Company. See note 24.
|
NOTE 12: CASH AND CASH EQUIVALENTS
|
December 31,
|
||||||||
|
2010
|
2009
|
|||||||
|
Cash
|
||||||||
|
Cash at bank and on hand
|
359
|
438
|
||||||
|
Cash equivalents
|
||||||||
|
Short-term deposits
|
158
|
285
|
||||||
|
Money market accounts
|
208
|
388
|
||||||
|
Commercial paper investments
|
139
|
-
|
||||||
|
Cash and cash equivalents
|
864
|
1,111
|
||||||
Of total cash and cash equivalents as of December 31, 2010, $234 million (2009 – $96 million) was held in subsidiaries which have regulatory restrictions, contractual restrictions or operate in countries where exchange controls and other legal restrictions apply and are therefore not available for general use by the Company.
NOTE 13: TRADE AND OTHER RECEIVABLES
|
December 31,
|
||||||||
|
2010
|
2009
|
|||||||
|
Trade receivables
|
1,893
|
1,854
|
||||||
|
Less: allowance for doubtful accounts
|
(39
|
) |
(38
|
) | ||||
|
Less: allowance for sales adjustments
|
(95
|
) |
(97
|
) | ||||
|
Net trade receivables
|
1,759
|
1,719
|
||||||
|
Other receivables
|
50
|
23
|
||||||
|
Trade and other receivables
|
1,809
|
1,742
|
||||||
The aging of gross trade receivables at each reporting date was as follows:
|
December 31,
|
||||||||
|
2010
|
2009
|
|||||||
|
Current
|
1,410
|
1,322
|
||||||
|
Past due 1-30 days
|
152
|
183
|
||||||
|
Past due 31-60 days
|
160
|
170
|
||||||
|
Past due 61-90 days
|
42
|
50
|
||||||
|
Past due >91 days
|
129
|
129
|
||||||
|
Balance at December 31
|
1,893
|
1,854
|
||||||
Thomson Reuters Annual Report 2010
99
Allowance for doubtful accounts
The change in the allowance for doubtful accounts was as follows:
|
December 31,
|
||||||||
|
2010
|
2009
|
|||||||
|
Balance at beginning of year
|
38
|
40
|
||||||
|
Charges
|
50
|
58
|
||||||
|
Write-offs
|
(49
|
) |
(60
|
) | ||||
|
Balance at end of year
|
39
|
38
|
||||||
The Company is exposed to normal credit risk with respect to its accounts receivable and maintains provisions for potential credit losses. Potential for such losses is mitigated because there is no significant exposure to any single customer and because customer creditworthiness is evaluated before credit is extended.
NOTE 14: PREPAID EXPENSES AND OTHER CURRENT ASSETS
|
December 31,
|
||||||||
|
2010
|
2009
|
|||||||
|
Inventory
|
86
|
79
|
||||||
|
Prepaid expenses
|
434
|
371
|
||||||
|
Other current assets
|
392
|
284
|
||||||
|
Prepaid expenses and other current assets
|
912
|
734
|
||||||
Other current assets was principally comprised of receivables for current income taxes, value added taxes and other indirect taxes.
Thomson Reuters Annual Report 2010
100
NOTE 15: COMPUTER HARDWARE AND OTHER PROPERTY
Computer hardware and other property consist of the following:
|
Computer hardware
|
Land, buildings and building improvements
|
Furniture, fixtures and equipment
|
Total
|
|||||||||||||
|
Cost:
|
||||||||||||||||
|
December 31, 2008
|
1,541
|
982
|
476
|
2,999
|
||||||||||||
|
Additions:
|
||||||||||||||||
|
Capital expenditures
|
353
|
93
|
45
|
491
|
||||||||||||
|
Acquisitions
|
2
|
6
|
-
|
8
|
||||||||||||
|
Disposals
|
(56
|
)
|
(8
|
)
|
(7
|
)
|
(71
|
)
|
||||||||
|
Translation and other, net
|
(7
|
)
|
48
|
(3
|
)
|
38
|
||||||||||
|
December 31, 2009
|
1,833
|
1,121
|
511
|
3,465
|
||||||||||||
|
Additions:
|
||||||||||||||||
|
Capital expenditures
|
348
|
67
|
55
|
470
|
||||||||||||
|
Acquisitions
|
2
|
2
|
2
|
6
|
||||||||||||
|
Disposals
|
(79
|
)
|
(6
|
)
|
(24
|
)
|
(109
|
)
|
||||||||
|
Translation and other, net
|
(3
|
)
|
28
|
(20
|
)
|
5
|
||||||||||
|
December 31, 2010
|
2,101
|
1,212
|
524
|
3,837
|
||||||||||||
|
Accumulated depreciation:
|
||||||||||||||||
|
December 31, 2008
|
(921
|
)
|
(262
|
)
|
(260
|
)
|
(1,443
|
)
|
||||||||
|
Current year depreciation
|
(393
|
)
|
(65
|
)
|
(51
|
)
|
(509
|
)
|
||||||||
|
Disposals
|
51
|
4
|
4
|
59
|
||||||||||||
|
Translation and other, net
|
(15
|
)
|
(7
|
)
|
(4
|
)
|
(26
|
)
|
||||||||
|
December 31, 2009
|
(1,278
|
)
|
(330
|
)
|
(311
|
)
|
(1,919
|
)
|
||||||||
|
Current year depreciation
|
(335
|
)
|
(76
|
)
|
(46
|
)
|
(457
|
)
|
||||||||
|
Disposals
|
75
|
6
|
21
|
102
|
||||||||||||
|
Translation and other, net
|
8
|
-
|
(4
|
)
|
4
|
|||||||||||
|
December 31, 2010
|
(1,530
|
)
|
(400
|
)
|
(340
|
)
|
(2,270
|
)
|
||||||||
|
Carrying amount:
|
||||||||||||||||
|
December 31, 2009
|
555
|
791
|
200
|
1,546
|
||||||||||||
|
December 31, 2010
|
571
|
812
|
184
|
1,567
|
||||||||||||
Fully depreciated assets are retained in asset and accumulated depreciation accounts until such assets are removed from service. Proceeds from disposals are netted against the related assets and the accumulated depreciation and included in earnings.
Thomson Reuters Annual Report 2010
101
NOTE 16: COMPUTER SOFTWARE
Computer software consists of the following:
|
Computer Software
|
||||
|
Cost:
|
||||
|
December 31, 2008
|
3,320
|
|||
|
Additions:
|
||||
|
Internally developed
|
579
|
|||
|
Purchased
|
35
|
|||
|
Acquisitions
|
55
|
|||
|
Disposals
|
(46)
|
|
||
|
Translation and other, net
|
150
|
|||
|
December 31, 2009
|
4,093
|
|||
|
Additions:
|
||||
|
Internally developed
|
564
|
|||
|
Purchased
|
67
|
|||
|
Acquisitions
|
57
|
|||
|
Disposals
|
(81)
|
|
||
|
Translation and other, net
|
4
|
|||
|
December 31, 2010
|
4,704
|
|||
|
|
||||
|
Accumulated amortization:
|
||||
|
December 31, 2008
|
(2,021)
|
|
||
|
Current year amortization
|
(548)
|
|
||
|
Disposals
|
38
|
|||
|
Translation and other, net
|
(67)
|
|
||
|
December 31, 2009
|
(2,598)
|
|
||
|
Current year amortization
|
(572)
|
|
||
|
Disposals
|
77
|
|||
|
Translation and other, net
|
2
|
|||
|
December 31, 2010
|
(3,091)
|
|
||
|
|
||||
|
Carrying amount:
|
||||
|
December 31, 2009
|
1,495
|
|||
|
December 31, 2010
|
1,613
|
|||
Fully amortized assets are retained in asset and accumulated amortization accounts until such assets are removed from service. Proceeds from disposals are netted against the related assets and the accumulated amortization and included in earnings.
Thomson Reuters Annual Report 2010
102
NOTE 17: OTHER IDENTIFIABLE INTANGIBLE ASSETS
|
Indefinite useful life
|
Finite useful life
|
|||||||||||||||||||||||
|
Trade
names
|
Trade
names
|
Customer relationships
|
Databases and
content
|
Other
|
Total
|
|||||||||||||||||||
|
Cost:
|
||||||||||||||||||||||||
|
December 31, 2008
|
2,458
|
264
|
6,023
|
841
|
1,446
|
11,032
|
||||||||||||||||||
|
Acquisitions
|
-
|
8
|
142
|
13
|
8
|
171
|
||||||||||||||||||
|
Disposals
|
-
|
(4
|
)
|
(15
|
)
|
(2
|
)
|
(8
|
)
|
(29
|
)
|
|||||||||||||
|
Translation and other, net
|
188
|
16
|
134
|
16
|
75
|
429
|
||||||||||||||||||
|
December 31, 2009
|
2,646
|
284
|
6,284
|
868
|
1,521
|
11,603
|
||||||||||||||||||
|
Acquisitions
|
-
|
53
|
242
|
77
|
211
|
583
|
||||||||||||||||||
|
Disposals
|
-
|
(9
|
)
|
-
|
-
|
(8
|
)
|
(17
|
)
|
|||||||||||||||
|
Translation and other, net
|
-
|
4
|
15
|
(5
|
)
|
8
|
22
|
|||||||||||||||||
|
December 31, 2010
|
2,646
|
332
|
6,541
|
940
|
1,732
|
12,191
|
||||||||||||||||||
|
Accumulated amortization:
|
||||||||||||||||||||||||
|
December 31, 2008
|
-
|
(129
|
)
|
(1,022
|
)
|
(450
|
)
|
(729
|
)
|
(2,330
|
)
|
|||||||||||||
|
Current year amortization
|
-
|
(21
|
)
|
(381
|
)
|
(41
|
)
|
(56
|
)
|
(499
|
)
|
|||||||||||||
|
Impairment
|
-
|
-
|
-
|
-
|
(8
|
)
|
(8
|
)
|
||||||||||||||||
|
Disposals
|
-
|
2
|
7
|
1
|
6
|
16
|
||||||||||||||||||
|
Translation and other, net
|
-
|
(4
|
)
|
(22
|
)
|
(13
|
)
|
(49
|
)
|
(88
|
)
|
|||||||||||||
|
December 31, 2009
|
-
|
(152
|
)
|
(1,418
|
)
|
(503
|
)
|
(836
|
)
|
(2,909
|
)
|
|||||||||||||
|
Current year amortization
|
-
|
(31
|
)
|
(406
|
)
|
(47
|
)
|
(61
|
)
|
(545
|
)
|
|||||||||||||
|
Disposals
|
-
|
9
|
-
|
-
|
8
|
17
|
||||||||||||||||||
|
Translation and other, net
|
-
|
(2
|
)
|
(8
|
)
|
6
|
(36
|
)
|
(40
|
)
|
||||||||||||||
|
December 31, 2010
|
-
|
(176
|
)
|
(1,832
|
)
|
(544
|
)
|
(925
|
)
|
(3,477
|
)
|
|||||||||||||
|
Carrying amount:
|
||||||||||||||||||||||||
|
December 31, 2009
|
2,646
|
132
|
4,866
|
365
|
685
|
8,694
|
||||||||||||||||||
|
December 31, 2010
|
2,646
|
156
|
4,709
|
396
|
807
|
8,714
|
||||||||||||||||||
The carrying amount of other identifiable intangible assets at December 31, 2010 includes the following:
|
|
●
|
$1,939 million of indefinite-lived trade names and $3,348 million of customer relationships, which have a remaining amortization period of 11 to 13 years, each arising from the Reuters acquisition; and
|
|
|
●
|
$707 million of indefinite-lived trade names associated with West.
|
The following table shows the carrying amount of indefinite-lived identifiable intangible assets by cash generating unit:
|
Carrying amount of indefinite lived intangible assets at
|
||||||||
|
December 31,
|
||||||||
|
Cash Generating Unit
|
2010
|
2009
|
||||||
|
West
|
707
|
707
|
||||||
|
Markets
|
1,939
|
1,939
|
||||||
|
Total indefinite-lived intangible assets
|
2,646
|
2,646
|
||||||
Based on the strength, long history and expected future use of these trade names, they have been assigned indefinite lives.
Thomson Reuters Annual Report 2010
103
NOTE 18: GOODWILL
The following table presents goodwill for the years ended December 31, 2010 and 2009:
|
2010
|
2009
|
|||||||
|
Net balance at January 1
|
18,130
|
18,324
|
||||||
|
Deferred tax asset adjustment (1)
|
-
|
(385)
|
|
|||||
|
Acquisitions
|
698
|
167
|
||||||
|
Impairment
|
-
|
(1)
|
|
|||||
|
Disposals
|
-
|
(42)
|
|
|||||
|
Translation & other, net
|
64
|
67
|
||||||
|
Balance at December 31
|
18,892
|
18,130
|
||||||
|
Gross balance at December 31
|
18,892
|
18,135
|
||||||
|
Accumulated impairment losses
|
-
|
(5)
|
|
|||||
|
Net balance at December 31
|
18,892
|
18,130
|
||||||
|
(1)
|
In 2009, in connection with the realization of a previously unrecognized pre-acquisition deferred tax asset, a $385 million reduction to goodwill was recorded as expense (see note 8).
|
Impairment test of goodwill
The Company performed its annual test for goodwill impairment in the fourth quarter of 2010 in accordance with its policy described in note 1. The estimated fair value less cost to sell of all units exceeded their carrying values. As a result, no goodwill impairment was recorded.
The Company has 12 CGUs, all of which include goodwill. The carrying value of goodwill for significant CGUs is identified separately in the table below. “All other” comprises goodwill allocated to the remaining CGUs:
|
Carrying amount of goodwill at
|
||||||||
|
December 31,
|
||||||||
|
Cash Generating Unit
|
2010
|
2009 (1)
|
||||||
|
West
|
2,894
|
2,590
|
||||||
|
Markets
|
13,505
|
13,140
|
||||||
|
All other
|
2,493
|
2,400
|
||||||
|
Total goodwill
|
18,892
|
18,130
|
||||||
|
(1)
|
2009 is presented on a comparable basis to 2010, reflecting a realignment of the Company’s CGUs.
|
The valuation techniques, significant assumptions and sensitivities applied in the goodwill impairment test are described below:
Valuation Techniques
The Company did not make any changes to the valuation methodology used to assess goodwill impairment since the last annual impairment test. The recoverable value of each CGU was based on fair value less cost to sell, using a weighted average of the following two methods to estimate fair value:
Income approach
The income approach is predicated upon the value of the future cash flows that a business will generate going forward. The discounted cash flow (“DCF”) method was used which involves projecting cash flows and converting them into a present value equivalent through discounting. The discounting process uses a rate of return that is commensurate with the risk associated with the business or asset and the time value of money. This approach requires assumptions about revenue growth rates, operating margins, tax rates and discount rates.
Market approach
The market approach assumes that companies operating in the same industry will share similar characteristics and that company values will correlate to those characteristics. Therefore, a comparison of a CGU to similar companies whose financial information is publicly available may provide a reasonable basis to estimate fair value. Under the market approach, fair value is calculated based on EBITDA multiples of benchmark companies comparable to the businesses in each CGU. Data for the benchmark companies was obtained from publicly available information.
Thomson Reuters Annual Report 2010
104
Significant Assumptions
Weighting of Valuation Techniques
The Company weighted the results of the two valuation techniques noted above, consistently applied to each CGU, as follows: 60% income approach/40% market approach. The Company believes that given volatility in capital markets, it is appropriate to apply a heavier weighting to the income approach. The selection and weighting of the fair value techniques requires judgment.
Growth
The assumptions used were based on the Company’s internal budget. The Company projected revenue, operating margins and cash flows for a period of five years, and applied a perpetual long-term growth rate thereafter. In arriving at its forecasts, the Company considered past experience, economic trends such as GDP growth and inflation as well as industry and market trends. The projections also took into account the expected impact from new product initiatives, customer retention and integration programs, and the maturity of the markets in which each business operates.
Discount Rate
The Company assumed a discount rate in order to calculate the present value of its projected cash flows. The discount rate represented a weighted average cost of capital (“WACC”) for comparable companies operating in similar industries as the applicable CGU, based on publicly available information. The WACC is an estimate of the overall required rate of return on an investment for both debt and equity owners and serves as the basis for developing an appropriate discount rate. Determination of the WACC requires separate analysis of the cost of equity and debt, and considers a risk premium based on an assessment of risks related to the projected cash flows of each unit.
Lower discount rates were applied to CGUs whose cash flows are expected to be less volatile due to factors such as the maturity of the market they serve and their market position. Higher discount rates were applied to CGUs whose cash flows are expected to be more volatile due to competition, or participation in less stable geographic markets.
Tax Rate
The tax rates applied to the projections reflected intercompany transfer pricing agreements currently in effect which were assumed to be transferable to another market participant. In certain circumstances, the effective tax rates, which ranged from 41% to 25%, were below the statutory tax rates. Tax assumptions are sensitive to changes in tax laws as well as assumptions about the jurisdictions in which profits are earned. It is possible that actual tax rates could differ from those assumed.
The key assumptions used in performing the impairment test, by CGU, were as follows:
|
Markets
|
West
|
All Other
|
||||||||||
|
Discount rate
|
9.5 | % | 7.5 | % | 7.6% - 11.2 | % | ||||||
|
Perpetual growth rate
|
3.0 | % | 2.0 | % | 3.0 | % | ||||||
The fair value for each CGU was in excess of its carrying value. The excess ranged from 17% to 898% of the carrying value of the applicable CGU. Based on sensitivity analysis, no reasonably possible change in assumptions would cause the carrying amount of any CGU to exceed its recoverable amount.
Thomson Reuters Annual Report 2010
105
NOTE 19: FINANCIAL INSTRUMENTS
Financial assets and liabilities
Financial assets and liabilities in the statement of financial position were as follows:
|
December 31, 2010
|
Cash, loans and receivables
|
Assets/ (liabilities) at fair value through earnings
|
Derivatives used for hedging (1)
|
Available for sale
|
Other financial liabilities
|
Total
|
||||||||||||||||||
|
Cash and cash equivalents
|
864
|
-
|
-
|
-
|
-
|
864
|
||||||||||||||||||
|
Trade and other receivables
|
1,809
|
-
|
-
|
-
|
-
|
1,809
|
||||||||||||||||||
|
Other financial assets – current
|
25
|
20
|
29
|
-
|
-
|
74
|
||||||||||||||||||
|
Other financial assets – non-current
|
157
|
-
|
287
|
16
|
-
|
460
|
||||||||||||||||||
|
Current indebtedness
|
-
|
-
|
-
|
-
|
(645
|
)
|
(645
|
)
|
||||||||||||||||
|
Trade payables (see note 21)
|
-
|
-
|
-
|
-
|
(519
|
)
|
(519
|
)
|
||||||||||||||||
|
Accruals (see note 21)
|
-
|
-
|
-
|
-
|
(1,943
|
)
|
(1,943
|
)
|
||||||||||||||||
|
Other financial liabilities – current
|
-
|
(118
|
) |
-
|
-
|
(24
|
)
|
(142
|
)
|
|||||||||||||||
|
Long term indebtedness
|
-
|
-
|
-
|
-
|
(6,873
|
)
|
(6,873
|
)
|
||||||||||||||||
|
Other financial liabilities – non current
|
-
|
-
|
(20
|
) |
-
|
(51
|
)
|
(71
|
)
|
|||||||||||||||
|
Total
|
2,855
|
(98
|
) |
296
|
16
|
(10,055
|
)
|
(6,986
|
)
|
|||||||||||||||
|
December 31, 2009
|
Cash, loans and receivables
|
Assets/ (liabilities) at fair value through earnings
|
Derivatives used for hedging (1)
|
Available for sale
|
Other financial liabilities
|
Total
|
||||||||||||||||||
|
Cash and cash equivalents
|
1,111
|
-
|
-
|
-
|
-
|
1,111
|
||||||||||||||||||
|
Trade and other receivables
|
1,742
|
-
|
-
|
-
|
-
|
1,742
|
||||||||||||||||||
|
Other financial assets – current
|
44
|
12
|
20
|
-
|
-
|
76
|
||||||||||||||||||
|
Other financial assets – non-current
|
163
|
-
|
199
|
21
|
-
|
383
|
||||||||||||||||||
|
Current indebtedness
|
-
|
-
|
-
|
-
|
(782
|
)
|
(782
|
)
|
||||||||||||||||
|
Trade payables (see note 21)
|
-
|
-
|
-
|
-
|
(422
|
)
|
(422
|
)
|
||||||||||||||||
|
Accruals (see note 21)
|
-
|
-
|
-
|
-
|
(1,685
|
)
|
(1,685
|
)
|
||||||||||||||||
|
Other financial liabilities – current
|
-
|
(26
|
)
|
(41
|
)
|
-
|
(25
|
)
|
(92
|
)
|
||||||||||||||
|
Long term indebtedness
|
-
|
-
|
-
|
-
|
(6,821
|
)
|
(6,821
|
)
|
||||||||||||||||
|
Other financial liabilities – non current
|
-
|
-
|
(42
|
)
|
-
|
-
|
(42
|
)
|
||||||||||||||||
|
Total
|
3,060
|
(14
|
)
|
136
|
21
|
(9,735
|
)
|
(6,532
|
)
|
|||||||||||||||
|
(1)
|
Derivatives are entered into with specific objectives for each transaction, and are linked to specific assets, liabilities or to specific firm commitments of forecasted transactions.
|
Thomson Reuters Annual Report 2010
106
The impact of fair value gains and losses from derivative financial instruments on the income statement and statement of changes in equity was as follows:
|
Year ended December 31,
|
||||||||||||||||
|
2010
|
2009
|
|||||||||||||||
|
Fair value gain (loss) through earnings
|
Fair value gain (loss) through equity
|
Fair value gain (loss) through earnings
|
Fair value gain (loss) through equity
|
|||||||||||||
|
Embedded derivatives
|
(72
|
) |
-
|
(147
|
) |
-
|
||||||||||
|
Hedging instruments:
|
||||||||||||||||
|
Cross currency interest rate swaps - fair value hedges
|
(31
|
) |
-
|
108
|
-
|
|||||||||||
|
Cross currency interest rate swaps – cash flow hedges(1)
|
123
|
(10
|
)
|
350
|
(54
|
) | ||||||||||
|
Other derivatives (2)
|
(8
|
) |
-
|
-
|
-
|
|||||||||||
|
12
|
(10
|
)
|
311
|
(54
|
) | |||||||||||
|
(1)
|
In 2009, of the $350 million in fair value gains related to cash flow hedges, $340 million was recorded as a component of "Net interest expense" and $10 million, relating to the early redemption of debt securities, was recycled from equity and recorded as a component of the "Other finance income (costs)" as described in note 7.
|
|
(2)
|
Represents derivatives used to manage foreign exchange risk on cash flows excluding indebtedness.
|
The ineffective portion recognized through earnings from fair value hedges was a loss of $2 million for the year ended December 31, 2010 (2009 - loss of $9 million). There was no ineffectiveness related to cash flow hedges.
Fair Value
The fair values of cash, loans and receivables, trade payables and accruals approximate their carrying amounts because of the short-term maturity of these instruments. The fair value of long term debt and related derivative instruments is set forth below.
Debt and Related Derivative Instruments
Carrying Amounts
Amounts recorded in the consolidated statement of financial position are referred to as “carrying amounts”. The carrying amounts of primary debt are reflected in “Long-term indebtedness” and “Current indebtedness” and the carrying amounts of derivative instruments are included in “Other financial assets” and “Other financial liabilities”, both current and long-term in the consolidated statement of financial position, as appropriate.
Fair Value
The fair value of debt is estimated based on either quoted market prices for similar issues or current rates offered to the Company for debt of the same maturity. The fair values of interest rate swaps and forward contracts are estimated based upon discounted cash flows using applicable current market rates and taking into account non-performance risk.
Thomson Reuters Annual Report 2010
107
The following is a summary of long-term debt and related derivative instruments that hedge the cash flows or fair value of the debt:
|
Carrying amount
|
Fair value
|
|||||||||||||||
|
As of December 31, 2010
|
Primary debt instruments
|
Derivative instruments (asset) liability
|
Primary debt instruments
|
Derivative instruments (asset) liability
|
||||||||||||
|
Bank and other
|
36
|
-
|
36
|
-
|
||||||||||||
|
C$600, 5.25% Notes, due 2011
|
612
|
(29
|
)
|
616
|
(29
|
)
|
||||||||||
|
C$600, 5.20% Notes, due 2014
|
617
|
(129
|
)
|
648
|
(129
|
)
|
||||||||||
|
C$600, 5.70% Notes, due 2015
|
602
|
20
|
663
|
20
|
||||||||||||
|
C$750, 6.00% Notes due 2016
|
751
|
(119
|
)
|
843
|
(119
|
)
|
||||||||||
|
C$750, 4.35% Notes due 2020
|
748
|
(39
|
)
|
746
|
(39
|
)
|
||||||||||
|
$250, 5.25% Notes, due 2013
|
249
|
-
|
272
|
-
|
||||||||||||
|
$750, 5.95% Notes, due 2013
|
746
|
-
|
832
|
-
|
||||||||||||
|
$800, 5.70% Notes, due 2014
|
794
|
-
|
887
|
-
|
||||||||||||
|
$1,000, 6.50% Notes, due 2018
|
989
|
-
|
1,165
|
-
|
||||||||||||
|
$500, 4.70% Notes due 2019
|
495
|
-
|
524
|
-
|
||||||||||||
|
$400, 5.50% Debentures, due 2035
|
392
|
-
|
390
|
-
|
||||||||||||
|
$500, 5.85% Debentures, due 2040
|
487
|
-
|
511
|
-
|
||||||||||||
|
Total
|
7,518
|
(296
|
) |
8,133
|
(296
|
)
|
||||||||||
|
Current portion
|
(645
|
) |
29
|
|||||||||||||
|
Long-term portion
|
6,873
|
(267
|
) | |||||||||||||
|
Carrying amount
|
Fair value
|
|||||||||||||||
|
As of December 31, 2009
|
Primary debt instruments
|
Derivative instruments (asset) liability
|
Primary debt instruments
|
Derivative instruments (asset) liability
|
||||||||||||
|
Bank and other
|
44
|
-
|
44
|
-
|
||||||||||||
|
C$600, 5.25% Notes, due 2011
|
592
|
(10
|
)
|
602
|
(10
|
)
|
||||||||||
|
C$600, 5.20% Notes, due 2014
|
584
|
(102
|
)
|
624
|
(102
|
)
|
||||||||||
|
C$600, 5.70% Notes, due 2015
|
570
|
41
|
627
|
41
|
||||||||||||
|
C$750, 6.00% Notes due 2016
|
710
|
(87
|
)
|
799
|
(87
|
)
|
||||||||||
|
€500, 4.625% Notes, due 2010
|
745
|
21
|
733
|
21
|
||||||||||||
|
$700, 6.20% Notes, due 2012
|
697
|
-
|
754
|
-
|
||||||||||||
|
$250, 5.25% Notes, due 2013
|
249
|
-
|
267
|
-
|
||||||||||||
|
$750, 5.95% Notes, due 2013
|
745
|
-
|
823
|
-
|
||||||||||||
|
$800, 5.70% Notes, due 2014
|
793
|
-
|
883
|
-
|
||||||||||||
|
$1,000, 6.50% Notes, due 2018
|
987
|
-
|
1,122
|
-
|
||||||||||||
|
$500, 4.70% Notes due 2019
|
495
|
-
|
493
|
-
|
||||||||||||
|
$400, 5.50% Debentures, due 2035
|
392
|
-
|
382
|
-
|
||||||||||||
|
Total
|
7,603
|
(137
|
)
|
8,153
|
(137
|
)
|
||||||||||
|
Current portion
|
(782
|
) |
(21
|
)
|
||||||||||||
|
Long-term portion
|
6,821
|
(158
|
)
|
|||||||||||||
The Company enters into derivative instruments to hedge its currency and interest rate risk exposures on indebtedness as follows:
Fair Value Hedges:
The Company held fixed-to-floating cross-currency interest rate swaps, which swap Canadian dollar and Euro principal and interest payments into U.S. dollars and change interest payments from a fixed to floating rate. These instruments were designated as fair value hedges and were recorded in the consolidated statement of financial position at their fair value which was a net asset position of $72 million at December 31, 2010 (2009 - net asset of $22 million). The details of these instruments are set forth below:
Thomson Reuters Annual Report 2010
108
|
Received
|
Paid
|
Hedged Risk
|
Year of Maturity
|
Principal Amount
|
|||
|
2010 fair value hedges
|
|||||||
|
Canadian dollar fixed
|
U.S. dollar floating
|
Interest rate and foreign exchange
|
2011
|
593 | |||
|
Canadian dollar fixed
|
U.S. dollar floating
|
Interest rate and foreign exchange
|
2014
|
123 | |||
|
2009 fair value hedges
|
|||||||
|
Canadian dollar fixed
|
U.S. dollar floating
|
Interest rate and foreign exchange
|
2011
|
593 | |||
|
Canadian dollar fixed
|
U.S. dollar floating
|
Interest rate and foreign exchange
|
2014
|
123 | |||
|
Euro fixed
|
U.S. dollar floating
|
Interest rate and foreign exchange
|
2010
|
762 | |||
Cash flow hedges:
To hedge currency risk exposures, the Company enters into fixed-to-fixed cross-currency swaps, which swap Canadian dollar principal and interest payments into U.S. dollars. These instruments were designated as cash flow hedges and were recorded in the consolidated statement of financial position at their fair value which was a net asset position of $224 million at December 31, 2010 (2009 – net asset of $115 million). The details of these instruments are set forth below:
|
Received
|
Paid
|
Hedged Risk
|
Year of Maturity
|
Principal Amount
|
|||
|
2010 cash flow hedges
|
|||||||
|
Canadian dollar fixed
|
U.S. dollar fixed
|
Foreign exchange
|
2014
|
369 | |||
|
Canadian dollar fixed
|
U.S. dollar fixed
|
Foreign exchange
|
2015
|
593 | |||
|
Canadian dollar fixed
|
U.S. dollar fixed
|
Foreign exchange
|
2016
|
610 | |||
|
Canadian dollar fixed
|
U.S. dollar fixed
|
Foreign exchange
|
2020
|
731 | |||
|
2009 cash flow hedges
|
|||||||
|
Canadian dollar fixed
|
U.S. dollar fixed
|
Foreign exchange
|
2014
|
369 | |||
|
Canadian dollar fixed
|
U.S. dollar fixed
|
Foreign exchange
|
2015
|
593 | |||
|
Canadian dollar fixed
|
U.S. dollar fixed
|
Foreign exchange
|
2016
|
610 | |||
Currency Risk Exposures
At each reporting date presented, substantially all indebtedness was denominated in U.S. dollars or had been swapped into U.S. dollar obligations.
The carrying amount of debt, all of which is unsecured, was denominated in the following currencies:
|
Before currency hedging arrangements
|
After currency hedging arrangements (1)
|
|||||||||||||||
|
2010
|
2009
|
2010
|
2009
|
|||||||||||||
|
Canadian dollar
|
3,336
|
2,465
|
7
|
9
|
||||||||||||
|
U.S. dollar
|
4,160
|
4,359
|
7,162
|
7,397
|
||||||||||||
|
Euro
|
3
|
747
|
3
|
2
|
||||||||||||
|
Other currencies
|
19
|
32
|
19
|
32
|
||||||||||||
|
7,518
|
7,603
|
7,191
|
7,440
|
|||||||||||||
|
(1)
|
Excludes fair value adjustments of ($31) million and ($26) million at December 31, 2010 and 2009, respectively.
|
Interest Rate Risk Exposures
As of December 31, 2010, the Company held 2 (2009 – 7) cross-currency interest rate swap agreements which swap interest rates from fixed to floating. After taking account of hedging arrangements, the fixed and floating rate mix of debt is as follows:
|
2010
|
Average
interest
rate
|
% Share
|
2009
|
Average
interest
rate
|
% Share
|
|||||||||||||||||||
|
Total fixed
|
6,476
|
5.7
|
% |
90
|
% |
5,943
|
5.9
|
% |
80
|
% | ||||||||||||||
|
Total floating
|
715
|
1.5
|
% |
10
|
% |
1,497
|
1.1
|
% |
20
|
% | ||||||||||||||
|
7,191
|
5.2
|
% |
100
|
% |
7,440
|
4.9
|
% |
100
|
% | |||||||||||||||
Floating rate long-term debt is London Interbank Offered Rate (“LIBOR”) based and, consequently, interest rates are reset periodically.
Thomson Reuters Annual Report 2010
109
2010 Activity
The following table outlines notes offered and repaid in 2010:
|
Date
|
Transaction
|
Principal
Amount
(in millions)
|
|
Notes offered
|
||
|
March 2010
|
5.85% notes due 2040
|
US$500
|
|
September 2010
|
4.35% notes due 2020
|
C$750
|
|
Notes repaid
|
||
|
March/April 2010
|
6.20% notes due 2012 (1)
|
US$700
|
|
November 2010
|
4.625% notes due 2010
|
€500
|
|
(1)
|
These notes were redeemed prior to their scheduled maturity.
|
The Company funded the early redemption of notes in March/April 2010 and the November 2010 debt maturity with the net proceeds from note offerings in March and September 2010, respectively, and with available cash resources. Upon completion of the September 2010 offering, the Company entered into fixed-to-fixed cross-currency swap agreements which converted the notes to $731 million principal amount at an interest rate of 3.91%.
The Company issued approximately $2.3 billion principal amount of debt securities under its debt shelf prospectus, which expired in January 2011. The Company expects to file a new debt shelf prospectus in the first quarter of 2011.
2009 Activity
The following table outlines notes offered and repaid in 2009:
|
Date
|
Transaction
|
Principal
Amount
(in millions)
|
|
Notes offered
|
||
|
March 2009
|
6.00% notes due 2016
|
C$750
|
|
September 2009
|
4.70% notes due 2019
|
US$500
|
|
Notes repaid
|
||
|
June 2009
|
4.50% notes due 2009
|
C$250
|
|
August 2009
|
4.25% notes due 2009
|
US$200
|
|
October 2009
|
7.74% notes due 2010(1)
|
US$75
|
|
October 2009
|
4.75% notes due 2010(1)
|
US$250
|
|
October 2009
|
6.85% notes due 2011(1)
|
C$400
|
|
December 2009
|
4.35% notes due 2009
|
C$300
|
|
(1)
|
These notes were redeemed prior to their scheduled maturity.
|
The Company funded the 2009 debt maturities and the early redemption of notes in October 2009 with the net proceeds from note offerings in March and September 2009, respectively, and with available cash resources. Upon completion of the March 2009 offering, the Company entered into fixed-to-fixed cross-currency swap agreements which converted the notes to $610 million principal amount at an interest rate of 6.915%.
Credit Facility
The Company has a $2.5 billion unsecured revolving credit facility that currently expires in August 2012. The Company may request an extension of the maturity date under certain circumstances for up to two additional one-year periods, which the applicable lenders may accept or decline in their sole discretion. The Company may also request an increase, subject to approval by applicable lenders, in the amount of the lenders’ commitments up to a maximum amount of $3.0 billion.
The facility may be used to provide liquidity in connection with the Company’s commercial paper program and for general corporate purposes. Based on the Company’s credit rating at December 31, 2010, the cost of borrowing under the agreement is priced at LIBOR plus 19 basis points (or plus 24 basis points on all borrowings when line utilization exceeds 50%). If the Company’s long-term debt rating were downgraded by Moody’s or Standard & Poor’s, the facility fee and borrowing costs may increase, although availability would be unaffected. Conversely, an upgrade in the Company’s ratings may reduce credit facility fees and borrowing costs.
Thomson Reuters Annual Report 2010
110
The facility contains certain customary affirmative and negative covenants, each with customary exceptions. Under the syndicated credit facility, the Company must maintain a ratio of net debt as of the last day of each fiscal quarter to EBITDA as defined in the credit facility agreement (earnings before interest, income taxes, depreciation and amortization and other modifications described in the credit facility agreement) for the last four quarters ended of not more than 4.5:1. Net debt is total debt adjusted to factor in the impact of swaps and other hedge agreements related to the debt, and is reduced to reflect the Company’s cash and cash equivalents balance. The Company was in compliance with this covenant at December 31, 2010.
At December 31, 2010 and 2009, undrawn and available bank facilities amounted to $2.5 billion.
Foreign Exchange Contracts
The Company uses foreign exchange contracts to manage foreign exchange risk on cash flows excluding indebtedness. In 2010, the Company implemented a program to mitigate such exposure by entering into a series of exchange contracts to purchase or sell certain currencies in the future at fixed amounts. The cumulative notional amounts of contracts outstanding at December 31, 2010 were $386 million to sell Euros, $218 million to buy British pounds sterling, and $113 million to sell Japanese yen. These arrangements settle at various dates over the next 12 months. The fair value of contracts outstanding at December 31, 2010 was a net liability of $9 million.
Embedded Derivatives
The majority of embedded derivatives arise as a result of U.S. dollar pricing of vendor or customer agreements by foreign subsidiaries. At December 31, 2010, the fair value of embedded derivatives represented a net payable of $88 million (2009 – net payable of $14 million).
Available for Sale Investments
At December 31, 2010 and 2009, available for sale investments were not material and are reported within “Other financial assets” – long term in the consolidated statement of financial position.
Financial Risk Management
The Company’s operations are diverse and global in nature and, therefore expose it to a variety of financial risks, which include market risk (primarily currency risk and interest rate risk), credit risk and liquidity risk. The Company’s risk management approach is to minimize the potential adverse effects from these risks on its financial performance. Financial risk management is carried out by a centralized corporate treasury group under strict guidelines and process controls. The treasury group identifies, evaluates and hedges financial risks. Relative to financial risks within the businesses, the corporate treasury group designs a risk management approach in close cooperation with each of the operating segments. The overall approach is under the oversight of the chief financial officer.
Market Risk
Currency Risk
The Company’s consolidated financial statements are expressed in U.S. dollars but a portion of its business is conducted in other currencies. Changes in the exchange rates for such currencies into U.S. dollars can increase or decrease revenues, operating profit, earnings and the carrying values of assets and liabilities.
|
|
●
|
Changes in exchange rates between 2009 and 2010 had no impact on consolidated revenues.
|
|
|
●
|
The translation effects of changes in exchange rates in the consolidated statement of financial position were net translation gains of $9 million in 2010 (2009: $0.7 billion) and are recorded within accumulated other comprehensive income in shareholders’ equity.
|
|
|
●
|
The Company only uses derivative instruments to reduce foreign currency and interest rate exposures. In particular, borrowings in currencies other than the U.S. dollar are generally converted to U.S. dollar obligations through the use of currency swap arrangements. At each reporting date presented, substantially all indebtedness was denominated in U.S. dollars or had been swapped into U.S. dollar obligations. Additionally, the Company enters into forward contracts to mitigate foreign exchange risk related to operating cash flows other than the U.S. dollar.
|
The table below shows the impact that a hypothetical change in foreign currency exchange rates would have on earnings as a result of changes in fair values of financial instruments as of December 31, 2010.
Thomson Reuters Annual Report 2010
111
|
10% weakening in foreign currency vs. US$
(in millions)
|
||||||||||||||||
|
Increase (decrease) to earnings
|
£
|
€
|
Other currencies
|
Total
|
||||||||||||
|
Impact on earnings from financial assets and liabilities(1)
|
-
|
(8
|
)
|
(8
|
)
|
(16
|
)
|
|||||||||
|
Impact on earnings from non-permanent intercompany loans
|
(16
|
)
|
(16
|
)
|
2
|
(30
|
)
|
|||||||||
|
Total impact on earnings
|
(16
|
)
|
(24
|
)
|
(6
|
)
|
(46
|
)
|
||||||||
|
(1)
|
Excludes long-term debt which has been swapped into U.S. dollar obligations.
|
Interest Rate Risk
The Company is exposed to fluctuations in interest rates with respect to cash and cash equivalents and long-term borrowings.
As of December 31, 2010, the majority of $864 million in cash and cash equivalents (2009 - $1.1 billion) were comprised of interest-bearing assets. Based on amounts as of December 31, 2010, a 100 basis point change in interest rates would change annual interest income by approximately $7 million (2009 - $9 million).
Substantially all borrowings were issued at fixed rates but a portion of such borrowings were converted into variable rate debt through the use of derivative instruments. At December 31, 2010, after taking into account swap agreements, 90% (2009 - 80%) of the total debt was at fixed rates of interest and the remainder was at floating rates of interest. Based upon these levels, a 100 basis point change in interest rates would increase or decrease the full-year interest expense by approximately $ 7 million (2009 - $15 million).
If the US$ interest rates were to increase by 100 basis points, the gain taken to equity in relation to cash flow hedges would be $138 million (2009 – $88 million). The equivalent increase in C$ interest rates would result in a loss taken to equity of $147 million (2009 – $94 million). A corresponding decrease in respective interest rates would have an approximately equal and opposite effect. Fluctuations in interest rates relating to fair value hedges have no effect, as any changes are entirely offset by adjustments to the hedged item which flow through the income statement.
Price Risk
The Company has no significant exposure to price risk from equity securities or commodities.
Credit Risk
Credit risk arises from cash and cash equivalents and derivative financial instruments, as well as credit exposure to customers including outstanding receivables. The Company attempts to minimize credit exposure to various instruments as follows:
|
|
●
|
Cash investments are placed with high-quality financial institutions with limited exposure to any one institution. At December 31, 2010, nearly all cash and cash equivalents were held by institutions that were rated at least “A”;
|
|
|
●
|
Counterparties to derivative contracts are major investment-grade international financial institutions and exposure to any single counterparty is monitored and limited.
|
|
|
●
|
Credit limits minimize exposure to any one customer.
|
No allowance for credit losses on financial assets was required as of December 31, 2010, other than the allowance for doubtful accounts (see note 13). Further, no financial or other assets have been pledged.
The Company’s maximum exposure with respect to credit, assuming no mitigating factors, would be the aggregate of its cash and cash equivalents $864 million (2009 - $1.1 billion), derivative exposure $316 million (2009 - $219 million), accounts and notes receivable $1.8 billion (2009 - $1.7 billion) and other financial assets $182 million (2009 - $207 million).
Liquidity Risk
A centralized treasury function ensures that the Company maintains funding flexibility by assessing future cash flow expectations and by maintaining sufficient headroom on its committed borrowing facilities. Cash flow estimates are based on rolling forecasts of operating, investing and financing flows. Such forecasting also takes into account borrowing limits, cash restrictions and compliance with debt covenants.
Cash which is surplus to working capital requirements is managed by the centralized treasury function which invests it in money market funds or bank money market deposits, choosing maturities which are aligned with expected cash needs based on the rolling forecast process.
Thomson Reuters Annual Report 2010
112
The table below sets forth non-derivative and derivative financial liabilities by maturity based on the remaining period from December 31, to the contractual maturity date. The amounts disclosed are the contractual undiscounted cash flows.
|
December 31, 2010
|
2011
|
2012
|
2013
|
2014
|
2015
|
Thereafter
|
Total
|
||||||||||||||||||
|
Long-term debt (1)
|
598
|
-
|
1,000
|
1,387
|
588
|
3,887
|
7,460
|
||||||||||||||||||
|
Interest payable (1)
|
404
|
384
|
360
|
315
|
235
|
1,563
|
3,261
|
||||||||||||||||||
|
Debt-related hedges outflows (2)
|
727
|
127
|
129
|
620
|
685
|
1,487
|
3,775
|
||||||||||||||||||
|
Debt-related hedges inflows (2)
|
(759
|
) |
(141
|
) |
(140
|
) |
(725
|
) |
(684
|
) |
(1,648
|
) |
(4,097
|
) | |||||||||||
|
Trade payables
|
519
|
-
|
-
|
-
|
-
|
-
|
519
|
||||||||||||||||||
|
Accruals
|
1,943
|
-
|
-
|
-
|
-
|
-
|
1,943
|
||||||||||||||||||
|
Other financial liabilities
|
175
|
3
|
-
|
-
|
-
|
-
|
178
|
||||||||||||||||||
|
Total
|
3,607
|
373
|
1,349
|
1,597
|
824
|
5,289
|
13,039
|
||||||||||||||||||
|
December 31, 2009
|
2010
|
2011
|
2012
|
2013
|
2014
|
Thereafter
|
Total
|
||||||||||||||||||
|
Long-term debt (1)
|
716
|
570
|
700
|
1,000
|
1,370
|
3,188
|
7,544
|
||||||||||||||||||
|
Interest payable (1)
|
423
|
381
|
322
|
296
|
251
|
869
|
2,542
|
||||||||||||||||||
|
Debt-related hedges outflows (2)
|
878
|
701
|
101
|
102
|
593
|
1,277
|
3,652
|
||||||||||||||||||
|
Debt-related hedges inflows (2)
|
(882
|
) |
(694
|
) |
(105
|
) |
(105
|
) |
(673
|
) |
(1,360
|
) |
(3,819
|
) | |||||||||||
|
Trade payables
|
422
|
-
|
-
|
-
|
-
|
-
|
422
|
||||||||||||||||||
|
Accruals
|
1,685
|
-
|
-
|
-
|
-
|
-
|
1,685
|
||||||||||||||||||
|
Other financial liabilities
|
89
|
6
|
-
|
-
|
-
|
-
|
95
|
||||||||||||||||||
|
Total
|
3,331
|
964
|
1,018
|
1,293
|
1,541
|
3,974
|
12,121
|
||||||||||||||||||
|
(1)
|
Represents contractual principal and interest payments. Future cash flows have been calculated using forward foreign exchange rates.
|
|
(2)
|
Substantially all non-U.S. dollar-denominated debt has been hedged into U.S. dollars. Debt-related hedges outflows represent projected payments to counterparties. Where future interest cash flows are not fixed, amounts have been calculated using forward interest rates. Debt-related hedges inflows represent projected cash receipts from counterparties. These future cash flows have been calculated using forward foreign exchange rates.
|
Capital Management
As at December 31, 2010, total capital was comprised of equity with a fair value of approximately $31.1 billion and debt of $7.5 billion. As at December 31, 2010, cash and cash equivalents were $0.9 billion.
The Company generates sufficient cash flow to meet its current obligations as well as allowing for: (i) re-investment in the business; (ii) debt service; and (iii) returns to shareholders in the form of dividends and share buybacks. In addition to cash generation, the Company’s investment grade credit provides added financial flexibility and the ability to borrow to support the operations and growth strategies of the business.
As of December 31, 2010, the Company’s credit ratings were as follows:
|
Moody's
|
Standard & Poor's
|
DBRS Limited
|
Fitch
|
|
|
Long-term debt
|
Baa1
|
A-
|
A (low)
|
A-
|
|
Commercial paper
|
-
|
A-1 (low)
|
R-1 (low)
|
F2
|
|
Trend/Outlook
|
Stable
|
Stable
|
Stable
|
Stable
|
The Company also monitors its capital on the basis of “net debt”. Net debt is defined as total indebtedness, including the associated fair value hedging instruments (swaps) on debt, but excluding unamortized transaction costs and premiums or discounts associated with such debt, less cash and cash equivalents. As the Company hedges some of its debt to reduce risk, the hedging instruments are included in the measurement of the total obligation associated with its outstanding debt. However, because the Company generally intends to hold the debt and related hedges to maturity, it does not consider the associated fair market value of cash flow hedges in the measurements. Gross indebtedness is reduced by cash and cash equivalents on the basis that they could be used to pay down debt.
Thomson Reuters Annual Report 2010
113
The following table presents the calculation of net debt:
|
December 31,
|
||||||||
|
2010
|
2009
|
|||||||
|
Current indebtedness
|
645
|
782
|
||||||
|
Long-term debt
|
6,873
|
6,821
|
||||||
|
Total debt
|
7,518
|
7,603
|
||||||
|
Swaps
|
(296
|
)
|
(137
|
) | ||||
|
Total debt after swaps
|
7,222
|
7,466
|
||||||
|
Remove fair value adjustments for hedges (1)
|
(31
|
)
|
(26
|
) | ||||
|
Remove transaction costs and discounts included in carrying value of debt
|
62
|
54
|
||||||
|
Less: cash and cash equivalents
|
(864
|
)
|
(1,111
|
) | ||||
|
Net debt (1)
|
6,389
|
6,383
|
||||||
|
(1)
|
Amounts are removed to reflect net cash outflow upon maturity.
|
Fair value estimation
The following fair value measurement hierarchy is used for financial instruments that are measured in the statement of financial position at fair value:
|
|
●
|
Level 1 - quoted prices (unadjusted) in active markets for identical assets or liabilities;
|
|
|
●
|
Level 2 - inputs other than quoted prices included within level 1 that are observable for the asset or liability, either directly (that is, as prices) or indirectly (that is, derived from prices); and
|
|
|
●
|
Level 3 - inputs for the asset or liability that are not based on observable market data (that is, unobservable inputs).
|
The levels used to determine fair value measurements for those instruments carried at fair value in the financial statements were as follows:
|
December 31, 2010
|
Total
|
|||||||||||||||
|
Assets
|
Level 1
|
Level 2
|
Level 3
|
Balance
|
||||||||||||
|
Financial assets at fair value through earnings
|
-
|
20
|
-
|
20
|
||||||||||||
|
Derivatives used for hedging
|
-
|
316
|
-
|
316
|
||||||||||||
|
Available for sale
|
16
|
-
|
-
|
16
|
||||||||||||
|
Total assets
|
16
|
336
|
-
|
352
|
||||||||||||
|
Liabilities
|
||||||||||||||||
|
Financial liabilities at fair value through earnings
|
-
|
(118
|
)
|
-
|
(118
|
)
|
||||||||||
|
Derivatives used for hedging
|
-
|
(20
|
)
|
-
|
(20
|
)
|
||||||||||
|
Total liabilities
|
-
|
(138
|
)
|
-
|
(138
|
)
|
||||||||||
|
December 31, 2009
|
Total
|
|||||||||||||||
|
Assets
|
Level 1
|
Level 2
|
Level 3
|
Balance
|
||||||||||||
|
Financial assets at fair value through earnings
|
-
|
12
|
-
|
12
|
||||||||||||
|
Derivatives used for hedging
|
-
|
219
|
-
|
219
|
||||||||||||
|
Available for sale
|
21
|
-
|
-
|
21
|
||||||||||||
|
Total assets
|
21
|
231
|
-
|
252
|
||||||||||||
|
Liabilities
|
||||||||||||||||
|
Financial liabilities at fair value through earnings
|
-
|
(26
|
)
|
-
|
(26
|
)
|
||||||||||
|
Derivatives used for hedging
|
-
|
(83
|
)
|
-
|
(83
|
)
|
||||||||||
|
Total liabilities
|
-
|
(109
|
)
|
-
|
(109
|
)
|
||||||||||
The fair value of financial instruments that are not traded in an active market (for example, over-the-counter derivatives) is determined by using valuation techniques. These valuation techniques maximize the use of observable market data where it is available and rely as little as possible on entity specific estimates. If all significant inputs required to fair value an instrument are observable, the instrument is included in level 2. If one or more of the significant inputs is not based on observable market data, the instrument is included in level 3.
Thomson Reuters Annual Report 2010
114
Specific valuation techniques used to value financial instruments include:
|
|
●
|
quoted market prices or dealer quotes for similar instruments; and
|
|
|
●
|
the fair value of currency and interest rate swaps and also forward foreign exchange contracts is calculated as the present value of the estimated future cash flows based on observable yield curves.
|
NOTE 20: OTHER NON-CURRENT ASSETS
|
December 31,
|
||||||||
|
2010
|
2009
|
|||||||
|
Net defined benefit plan surpluses (see note 26)
|
48
|
64
|
||||||
|
Cash surrender value of life insurance policies
|
237
|
259
|
||||||
|
Investments in equity method investees
|
247
|
298
|
||||||
|
Other non-current assets
|
26
|
28
|
||||||
|
Total other non-current assets
|
558
|
649
|
||||||
NOTE 21: PAYABLES, ACCRUALS AND PROVISIONS
|
December 31,
|
||||||||
|
2010
|
2009
|
|||||||
|
Trade payables
|
519
|
422
|
||||||
|
Accruals
|
1,943
|
1,685
|
||||||
|
Provisions (see note 22)
|
203
|
277
|
||||||
|
Other current liabilities
|
259
|
267
|
||||||
|
Total payables, accruals and provisions
|
2,924
|
2,651
|
||||||
NOTE 22: PROVISIONS AND OTHER NON-CURRENT LIABILITIES
|
December 31,
|
||||||||
|
2010
|
2009
|
|||||||
|
Net defined benefit plan obligations (see note 26)
|
1,026
|
833
|
||||||
|
Deferred compensation and employee incentives
|
239
|
192
|
||||||
|
Provisions
|
181
|
144
|
||||||
|
Unfavorable contract liability
|
208
|
290
|
||||||
|
Uncertain tax positions
|
459
|
332
|
||||||
|
Other non-current liabilities
|
104
|
87
|
||||||
|
Total provisions and other non-current liabilities
|
2,217
|
1,878
|
||||||
Thomson Reuters Annual Report 2010
115
The following table presents the movement in provisions for the years ended December 31, 2010 and 2009:
|
|
|
Integration & restructuring
|
Other
provisions
|
Total
provisions
|
||||||||
|
Balance at December 31, 2008
|
204
|
179
|
383
|
|||||||||
|
Charges
|
127
|
110
|
237
|
|
||||||||
|
Utilization
|
(161
|
) |
(49
|
) |
(210
|
) | ||||||
|
Translation and other
|
15
|
(4
|
) |
11
|
|
|||||||
|
Balance at December 31, 2009
|
185
|
236
|
421
|
|
||||||||
|
Less: short-term provisions
|
142
|
135
|
277
|
|
||||||||
|
Long-term provisions
|
43
|
101
|
144
|
|
||||||||
|
|
||||||||||||
|
Balance at December 31, 2009
|
185
|
236
|
421
|
|
||||||||
|
Charges
|
126
|
22
|
148
|
|
||||||||
|
Utilization
|
(149
|
) |
(41
|
) |
(190
|
) | ||||||
|
Translation and other
|
(16
|
) |
21
|
5
|
||||||||
|
Balance at December 31, 2010
|
146
|
238
|
384
|
|||||||||
|
Less: short-term provisions
|
121
|
82
|
203
|
|||||||||
|
Long-term provisions
|
25
|
156
|
181
|
|||||||||
Integration and restructuring provisions relate to the integration program initiated by the Company in conjunction with the Reuters acquisition in 2008 and legacy efficiency initiatives of the Company and Reuters. These provisions primarily provide for severance obligations and remaining rental payments on vacated leases. The integration program is expected to be completed in 2011 and the lease-related provisions will be primarily utilized over the next five years. See note 5.
Other provisions include lease retirement obligations, which arise when the Company agrees to restore a leased property to a specified condition at the completion of the lease period. These lease retirement provisions relate primarily to leases which expire over the next ten years.
NOTE 23: DEFERRED TAX
The movements of deferred tax assets and liabilities are shown below:
|
Deferred tax liabilities
|
Goodwill and other identifiable intangible assets
|
Computer software, computer hardware and other property
|
Other
|
Total
|
||||||||||||
|
December 31, 2008
|
3,044
|
267
|
173
|
3,484
|
||||||||||||
|
Acquisitions
|
24
|
10
|
(2
|
)
|
32
|
|||||||||||
|
(Benefit) expense to income statement
|
(733
|
) |
37
|
220
|
(476
|
) | ||||||||||
|
Translation and other
|
101
|
(177
|
) |
(111
|
) |
(187
|
) | |||||||||
|
December 31, 2009
|
2,436
|
137
|
280
|
2,853
|
||||||||||||
|
Acquisitions
|
106
|
9
|
24
|
139
|
||||||||||||
|
(Benefit) expense to income statement
|
(149
|
) |
15
|
(36
|
) |
(170
|
) | |||||||||
|
Translation and other
|
12
|
11
|
3
|
26
|
||||||||||||
|
December 31, 2010
|
2,405
|
172
|
271
|
2,848
|
||||||||||||
Thomson Reuters Annual Report 2010
116
|
Deferred tax assets
|
Tax losses
|
Employee benefits
|
Deferred and share based compensation
|
Other
|
Total
|
|||||||||||||||
|
December 31, 2008
|
329
|
198
|
105
|
308
|
940
|
|||||||||||||||
|
Acquisitions
|
23
|
-
|
-
|
3
|
26
|
|||||||||||||||
|
(Expense) benefit to income statement
|
(44
|
) |
(18
|
) |
17
|
109
|
64
|
|||||||||||||
|
Benefit to equity
|
-
|
7
|
4
|
-
|
11
|
|||||||||||||||
|
Translation and other
|
46
|
65
|
14
|
(85
|
) |
40
|
||||||||||||||
|
December 31, 2009
|
354
|
252
|
140
|
335
|
1,081
|
|||||||||||||||
|
Acquisitions
|
4
|
-
|
-
|
-
|
4
|
|||||||||||||||
|
(Expense) benefit to income statement
|
(30
|
) |
49
|
29
|
(13
|
) |
35
|
|||||||||||||
|
Benefit to equity
|
-
|
58
|
9
|
-
|
67
|
|||||||||||||||
|
Translation and other
|
31
|
6
|
(1
|
) |
9
|
45
|
||||||||||||||
|
December 31, 2010
|
359
|
365
|
177
|
331
|
1,232
|
|||||||||||||||
|
Net deferred liability at December 31, 2009
|
(1,772
|
) | ||||||||||||||||||
|
Net deferred liability at December 31, 2010
|
(1,616
|
) | ||||||||||||||||||
The estimated recovery period for the deferred tax balances is shown below:
|
December 31,
|
||||||||
|
2010
|
2009
|
|||||||
|
Deferred tax liabilities
|
||||||||
|
Deferred tax liabilities to be recovered after more than 12 months
|
2,840
|
2,839
|
||||||
|
Deferred tax liabilities to be recovered within 12 months
|
8
|
14
|
||||||
|
Total deferred tax liabilities
|
2,848
|
2,853
|
||||||
|
Deferred tax assets
|
||||||||
|
Deferred tax assets to be recovered after more than 12 months
|
1,018
|
887
|
||||||
|
Deferred tax assets to be recovered within 12 months
|
214
|
194
|
||||||
|
Total deferred tax assets
|
1,232
|
1,081
|
||||||
|
Net deferred tax liability
|
1,616
|
1,772
|
||||||
At December 31, 2010, the Company had Canadian tax losses carried forward of $2,290 million, tax losses carried forward in other jurisdictions of $1,154 million, and U.S. state tax losses carried forward which, at current U.S. state rates, have an estimated value of $18 million. If not utilized, the majority of the Canadian tax losses and U.S. state tax losses carried forward will expire between 2011 and 2030. The majority of the tax losses carried forward in other jurisdictions may be carried forward indefinitely.
Deferred tax assets are recognized for tax loss carry-forwards to the extent that the realization of the related tax benefit through future taxable profits is probable. The ability to realize the tax benefits of these losses is dependent upon a number of factors, including the future profitability of operations in the jurisdictions in which the tax losses arose. At December 31, 2010, the Company did not recognize deferred tax assets of $603 million related to $2,210 million of tax losses carried forward.
At December 31, 2010, the Company had $649 million of capital losses carried forward which may only be used to offset future capital gains. The deferred tax asset not recognized in respect of these losses was $174 million.
No deferred tax is recognized on the unremitted earnings of overseas subsidiaries and joint ventures to the extent that the Company is able to control the timing of the reversal of the temporary differences, and it is probable that the temporary differences will not reverse in the foreseeable future. The temporary difference in respect of the amount of undistributed earnings of non-Canadian subsidiaries is approximately $16.6 billion at December 31, 2010. The amount of deferred tax provided in respect of distributions of profits expected to be remitted in 2011 is not material.
In the fourth quarter of 2009, the Company sold a wholly owned subsidiary whose only asset consisted of Canadian tax loss carry-forwards, to a company controlled by Woodbridge. This transaction had no impact on income tax expense as the losses had no value to the Company. See note 30.
Thomson Reuters Annual Report 2010
117
NOTE 24: CAPITAL
The change in capital, which includes stated capital and contributed surplus, was as follows:
|
Thomson Reuters Corporation Common Share Capital
|
Thomson Reuters PLC Ordinary Share Capital
|
|||||||||||||||||||||||||||
|
Number of Common shares
|
Stated capital
|
Number of Ordinary shares
|
Stated capital
|
Series II, cumulative redeemable preference share capital
|
Contributed surplus
|
Total capital
|
||||||||||||||||||||||
|
Balance, December 31, 2008
|
646,046,307 | 2,851 | 181,229,241 | 89 | 110 | 6,984 | 10,034 | |||||||||||||||||||||
|
DLC Unification
|
181,229,241 | 6,917 | (181,229,241 | ) | (89 | ) | - | (6,828 | ) | - | ||||||||||||||||||
|
Shares issued under DRIP
|
749,785 | 22 | - | - | - | - | 22 | |||||||||||||||||||||
|
Effect of stock compensation plans
|
1,732,980 | 57 | - | - | - | 64 | 121 | |||||||||||||||||||||
|
Balance, December 31, 2009
|
829,758,313 | 9,847 | - | - | 110 | 220 | 10,177 | |||||||||||||||||||||
|
Shares issued under DRIP
|
1,829,280 | 68 | - | - | - | - | 68 | |||||||||||||||||||||
|
Effect of stock compensation plans(1)
|
1,808,642 | 52 | - | - | - | (13 | ) | 39 | ||||||||||||||||||||
|
Balance, December 31, 2010
|
833,396,235 | 9,967 | - | - | 110 | 207 | 10,284 | |||||||||||||||||||||
|
(1)
|
Includes a reduction of $89 million relating to cash-settled awards. See note 1.
|
In September 2009, Thomson Reuters completed the unification of its DLC structure that it previously operated under from April 2008 with shareholders in two listed entities, the Company and Thomson Reuters PLC. The DLC structure had been implemented as a means to complete the acquisition of Reuters Group PLC in April 2008. As a result of the unification, the Company is the sole parent company. Unification was a change in corporate structure that had no impact on the Company’s global businesses, operations, strategy, financial position and employees. The former holders of Thomson Reuters PLC ordinary shares and existing holders of common shares of the Company, including the controlling shareholder of the Company, The Woodbridge Company Limited (“Woodbridge”), had the same ownership interest immediately after unification as they did immediately prior to unification.
Unification had no impact on the number of shares outstanding, as Thomson Reuters PLC ordinary shares and Thomson Reuters PLC American Depositary Shares were exchanged for an equivalent number of common shares of the Company. Additionally, unification had no impact on total capital as the carrying values of the then outstanding Thomson Reuters PLC stated share capital and contributed surplus were transferred into the stated share capital of the Company.
In March 2010, the Company completed an intercompany reorganization that included the amalgamation of the Company and Thomson Reuters UK Limited (formerly known as Thomson Reuters PLC), which had become a wholly owned subsidiary of the Company upon unification. This placed creditors of the Company in the same position that they would have been in had Thomson Reuters previously operated under a single parent company structure.
Common shares of the Company have no par value and the authorized common share capital is an unlimited number of shares.
Dividends
Dividends are declared in U.S. dollars. Details of dividends declared per share are as follows:
|
(U.S. per share amounts)
|
Year ended December 31,
|
|||||||
|
Dividends declared per share
|
2010
|
2009
|
||||||
|
Thomson Reuters Corporation common shares
|
$ |
1.16
|
$ |
1.12
|
||||
|
Thomson Reuters PLC ordinary shares (1)
|
-
|
$ |
0.84
|
|||||
|
(1)
|
On September 10, 2009, all Thomson Reuters PLC ordinary shares were exchanged for an equivalent number of common shares of the Company in connection with unification of the DLC structure.
|
In the statement of cash flow, dividends paid on shares are shown net of amounts reinvested in the Company’s DRIP. Details of dividend reinvestment are as follows:
|
Year ended December 31,
|
||||||||
|
2010
|
2009
|
|||||||
|
Dividend reinvestment
|
68
|
22
|
||||||
Thomson Reuters Annual Report 2010
118
Registered holders of common shares may participate in the DRIP, under which cash dividends are automatically reinvested in new common shares. Common shares are valued at the weighted-average price at which the shares traded on the TSX during the five trading days immediately preceding the record date for the dividend.
Share Repurchase Program
Under the Company’s current Normal Course Issuer Bid share repurchase facility, the Company may repurchase up to 15 million common shares (representing less than 2% of the total outstanding shares) in open market transactions on the TSX or the NYSE through May 12, 2011.
Although the Company has not repurchased any shares since 2008, it may buy back shares from time to time as part of its capital management strategy. Decisions regarding any future repurchases will be based on market conditions, share price and other factors including opportunities to invest capital for growth.
The Company may elect to suspend or discontinue its share repurchases at any time, in accordance with applicable laws. Shares that are repurchased are cancelled. From time to time when the Company does not possess material nonpublic information about itself or its securities, the Company may enter into a pre-defined plan with its broker to allow for the repurchase of shares at times when it ordinarily would not be active in the market due to its own internal trading blackout periods, insider trading rules or otherwise. Any such plans entered into with the Company’s broker will be adopted in accordance with applicable Canadian securities laws and the requirements of Rule 10b5-1 under the U.S. Securities Exchange Act of 1934, as amended.
Series II, Cumulative Redeemable Preference Shares
The authorized preference share capital of the Company is an unlimited number of preference shares without par value. The directors are authorized to issue preference shares without par value in one or more series, and to determine the number of shares in, and terms attaching to, each such series. As of December 31, 2010 and 2009, 6,000,000 Series II, cumulative redeemable preference shares were authorized, issued and outstanding. The Series II preference shares are non-voting and are redeemable at the option of the Company for C$25.00 per share, together with accrued dividends. Dividends are payable quarterly at an annual rate of 70% of the Canadian bank prime rate applied to the stated capital of such shares.
NOTE 25: SHARE-BASED COMPENSATION
The Company operates a number of equity-settled and cash-settled share-based compensation plans under which it receives services from employees as consideration for equity instruments of the Company or cash payments. Each plan is described below:
Stock Incentive Plan
Under its stock incentive plan, the Company may grant stock options, TRSUs, PRSUs and other awards to certain employees for a maximum of up to 50,000,000 common shares. As of December 31, 2010, there were 20,265,608 awards available for grant (2009 – 20,832,270).
The following table summarizes the valuation methods used to measure fair value for each type of award and the related vesting period over which compensation expense is recognized:
|
Equity settled
|
Cash settled (1)
|
|||
|
Type of award
|
Vesting period
|
Fair Value Measure
|
Compensation expense based on:
|
|
|
Stock options
|
Up to four years
|
Black-Scholes
option pricing model
|
Fair value on
business day prior
to grant date
|
Fair value
at reporting date
|
|
TRSUs
|
Up to seven years
|
Closing Common
share price
|
Fair value on
business day prior
to grant date
|
Fair value
at reporting date
|
|
PRSUs
|
Three year
performance period
|
Closing Common
share price
|
Fair value on
business day prior
to grant date
|
Fair value
at reporting date
|
|
(1)
|
Cash settled awards represent the portion of share-based compensation relating to withholding tax.
|
Thomson Reuters Annual Report 2010
119
Additional information on each type of award is as follows:
Stock Options
The maximum term of an option is 10 years from the date of grant. Under the plan, options may be granted by reference to the Company’s common share price on the NYSE or TSX, respectively.
The weighted-average fair value of options granted and principal assumptions used in applying the Black-Scholes option pricing model were as follows:
|
2010
|
2009
|
|||||||
|
Weighted average fair value ($)
|
8.92
|
6.98
|
||||||
|
|
||||||||
|
Weighted average of key assumptions:
|
||||||||
|
Share price ($)
|
35.22
|
23.30
|
||||||
|
Exercise price ($)
|
35.22
|
23.30
|
||||||
|
Risk-free interest rate
|
2.8
|
% |
2.7
|
% | ||||
|
Dividend yield
|
3.1
|
% |
2.6
|
% | ||||
|
Volatility factor
|
33
|
% |
37
|
% | ||||
|
Expected life (in years)
|
6
|
6
|
||||||
The Black-Scholes model was developed for use in estimating the fair value of traded options that have no vesting restrictions. The model requires the use of subjective assumptions, including expected stock-price volatility; historical data has been considered in setting the assumptions.
Time-Based Restricted Share Units (TRSUs)
TRSUs give the holder the right to receive one common share for each unit that vests on the vesting date. The holders of TRSUs have no voting rights, but accumulate additional units based on notional dividends paid by the Company on its common shares at each dividend payment date, which are reinvested as additional TRSUs. The weighted-average fair value of TRSUs granted was $36.55 and $31.57 for the years ended December 31, 2010 and 2009, respectively.
Performance Restricted Share Units (PRSUs)
PRSUs give the holder the right to receive one common share for each unit that vests on the vesting date. The holders of PRSUs have no voting rights and accumulate additional units based on notional dividends paid by the Company on its common shares on each dividend payment date, which are reinvested as additional PRSUs. The percentage of PRSUs initially granted that vests depends upon the Company’s performance over a three-year performance period against pre-established performance goals. Between 0% and 150% of the initial amounts may vest for grants made during 2008 and between 0% and 200% may vest for grants made in 2009 and 2010.
The weighted-average fair value of PRSUs granted was $35.40 and $23.33 for the years ended December 31, 2010 and 2009, respectively.
Employee Stock Purchase Plan (ESPP)
The Company maintains an ESPP whereby eligible employees can purchase common shares at a 15% discount to the closing share price on the NYSE as of the last business day of each quarter. Each quarter, employees may elect to authorize payroll deductions from their eligible compensation, up to a maximum of $21,250 per year (or a comparable amount in foreign currency for the global ESPP). The discount is expensed as incurred.
A maximum of 14,000,000 common shares can be purchased through the ESPP. The maximum number of shares currently issuable for the U.S. ESPP is 8,000,000 and for the global ESPP is 6,000,000.
Sharesave (SAYE)
During the second quarter of 2009, the Company implemented a Sharesave or “Save-as-you-earn” (“SAYE”) plan, as a subset of the global ESPP, whereby eligible employees were given the option to purchase Thomson Reuters PLC ordinary shares at a 15% discount at the end of the three-year contract savings period via limited payroll deductions. As a result of the Company’s DLC unification, options in Thomson Reuters PLC were exchanged for the right to acquire depositary interests representing common shares of the Company.
The Company expenses the fair value of compensation expense related to the SAYE grant over the three year vesting period using a Monte Carlo option pricing model to estimate fair value for each option at the date of grant.
Thomson Reuters Annual Report 2010
120
There were no grants under the SAYE in 2010 as the Company offered a traditional ESPP in the U.K. The weighted-average fair value of the 2009 options granted and principal assumptions used in applying the Monte Carlo option pricing model were as follows:
|
2009
|
||||
|
Weighted average fair value ($)
|
7.82
|
|||
|
|
||||
|
Weighted average of key assumptions:
|
||||
|
Share price ($)
|
26.14
|
|||
|
Exercise price ($)
|
19.62
|
|||
|
Risk-free interest rate
|
2.3
|
% | ||
|
Dividend yield
|
3.7
|
% | ||
|
Volatility factor
|
36
|
% | ||
|
Expected life (in years)
|
3.5
|
|||
|
Cancellation rate
|
25
|
% | ||
The model requires the use of subjective assumptions, including expected stock-price volatility; historical data has been considered in setting the assumptions.
Share Appreciation Rights (SARs)
The Company has a phantom stock plan that provides for the granting of stock appreciation rights (“SARs”) and other cash-based awards to certain employees. SARs provide the holder with the opportunity to receive a cash payment equal to the fair market value of the Company’s common shares less the grant price. The grant price is set at the closing price of the Company’s common shares on the business day prior to the date of grant. SARs vest over a four year period and expire four to ten years after the grant date. Compensation expense is recognized based on the fair value of the awards that are expected to vest and remain outstanding at the end of the reporting period. The Black-Scholes option pricing model is used to calculate an estimate of fair value. Awards are granted in U.S. and Canadian dollars by reference to the Company’s common share price on the NYSE and TSX, respectively.
There were no SAR grants in 2010. The weighted-average fair value of the 2009 SARs granted and principal assumptions used in applying the Black-Scholes option pricing model were as follows:
|
2009
|
||||
|
Weighted average fair value ($)
|
11.09
|
|||
|
|
||||
|
Weighted average of key assumptions:
|
||||
|
Share price ($)
|
32.25
|
|||
|
Exercise price ($)
|
23.25
|
|||
|
Risk-free interest rate
|
2.8
|
% | ||
|
Dividend yield
|
3.3
|
% | ||
|
Volatility factor
|
33
|
% | ||
|
Expected life (in years)
|
5.2
|
% | ||
The Black-Scholes model was developed for use in estimating the fair value of traded options that have no vesting restrictions. The model requires the use of subjective assumptions, including expected stock-price volatility; historical data and has been considered in setting the assumptions.
Thomson Reuters Annual Report 2010
121
The movement in the number of awards outstanding and their related weighted average exercise prices are as follows:
|
Stock Options
|
SAYE
|
TRSUs
|
PRSUs
|
SARs
|
Total
|
Weighted average exercise price ($)
|
||||||||||||||||||||||
|
Awards outstanding in thousands:
|
||||||||||||||||||||||||||||
|
Outstanding at December 31, 2008
|
14,391 | - | 3,068 | 2,849 | 673 | 20,981 | 26.43 | |||||||||||||||||||||
|
Granted
|
2,675 | 1,179 | 118 | 2,306 | 9 | 6,287 | 13.63 | |||||||||||||||||||||
|
Exercised
|
(46 | ) | - | (418 | ) | (516 | ) | - | (980 | ) | 1.23 | |||||||||||||||||
|
Forfeited
|
(222 | ) | (24 | ) | - | (116 | ) | (12 | ) | (374 | ) | 24.45 | ||||||||||||||||
|
Expired
|
- | - | - | - | (81 | ) | (81 | ) | 23.36 | |||||||||||||||||||
|
Outstanding at December 31, 2009
|
16,798 | 1,155 | 2,768 | 4,523 | 589 | 25,833 | 25.46 | |||||||||||||||||||||
|
Exercisable at December 31, 2009
|
12,040 | 188 | - | - | 530 | 12,758 | 38.72 | |||||||||||||||||||||
|
Granted
|
1,925 | - | 433 | 2,068 | - | 4,426 | 15.32 | |||||||||||||||||||||
|
Exercised
|
(1,933 | ) | (17 | ) | (484 | ) | (646 | ) | - | (3,080 | ) | 19.58 | ||||||||||||||||
|
Forfeited
|
(1,516 | ) | (132 | ) | (12 | ) | (325 | ) | (106 | ) | (2,091 | ) | 34.64 | |||||||||||||||
|
Expired
|
(2,004 | ) | - | - | - | (58 | ) | (2,062 | ) | 45.14 | ||||||||||||||||||
|
Outstanding at December 31, 2010
|
13,270 | 1,006 | 2,705 | 5,620 | 425 | 23,026 | 21.89 | |||||||||||||||||||||
|
Exercisable at December 31, 2010
|
8,129 | 1 | - | - | 394 | 8,524 | 37.74 | |||||||||||||||||||||
The weighted average share price at the time of exercise was $36.20 per share (2009 – $27.07).
Share-based compensation expense included in the income statement for years ended December 31, 2010 and 2009 was as follows:
|
Stock Options
|
SAYE
|
TRSUs
|
PRSUs
|
SARs
|
ESPP
|
Total
|
||||||||||||||||||||||
|
December 31, 2010 (1)
|
27
|
3
|
32
|
37
|
-
|
6
|
105
|
|||||||||||||||||||||
|
December 31, 2009
|
16
|
2
|
36
|
46
|
-
|
5
|
105
|
|||||||||||||||||||||
|
(1)
|
2010 includes $13 million relating to the revaluation of withholding taxes on stock based compensation awards, which is included within fair value adjustments in the presentation of “Operating expenses” in note 5.
|
The Company recorded a liability for cash-settled share incentive awards of $98 million at December 31, 2010 (2009: $2 million). The intrinsic value of the liability for vested awards was $22 million (2009: $1 million).
The following table summarizes additional information relating to the awards outstanding at December 31, 2010:
|
Range of exercise prices
|
Number Outstanding
(in thousands)
|
Weighted average remaining contractual life
(years)
|
Weighted average exercise price for plans outstanding
|
Number exercisable
(in thousands)
|
Weighted average exercise price for plans exercisable
|
|||||||||||||||
|
0.00 – 30.00
|
12,147
|
2.68
|
$ |
7.08
|
865
|
$ |
24.19
|
|||||||||||||
|
30.01 - 35.00
|
2,368
|
2.56
|
$ |
33.49
|
2,355
|
$ |
33.51
|
|||||||||||||
|
35.01 – 40.00
|
5,615
|
6.95
|
$ |
36.05
|
2,634
|
$ |
36.21
|
|||||||||||||
|
40.01 - 45.00
|
1,349
|
4.88
|
$ |
42.72
|
1,123
|
$ |
42.67
|
|||||||||||||
|
45.01 – 50.00
|
1,102
|
0.96
|
$ |
48.32
|
1,102
|
$ |
48.32
|
|||||||||||||
|
50.01 - 55.00
|
35
|
0.59
|
$ |
50.85
|
35
|
$ |
50.85
|
|||||||||||||
|
55.01 – 60.00
|
410
|
0.99
|
$ |
57.40
|
410
|
$ |
57.40
|
|||||||||||||
|
Total
|
23,026
|
8,524
|
||||||||||||||||||
NOTE 26: EMPLOYEE BENEFIT PLANS
Retirement Benefits
The Company sponsors both defined benefit and defined contribution employee future benefit plans covering substantially all employees. Costs for all future employee benefits are accrued over the periods in which employees earn the benefits. Defined benefit plans provide pension and other post-employment benefits (“OPEB”) to covered employees. Significant plans are valued under IAS 19, Employee Benefits, by independently qualified actuaries using the projected unit credit method. The largest defined benefit plans are Thomson Reuters Group Pension Plan and the Reuters Pension Fund.
Thomson Reuters Annual Report 2010
122
Net defined benefit plan obligations
The movement on net defined benefit plan obligations was as follows:
|
Pension Plans (1)
|
OPEB (1)
|
Total (1)
|
||||||||||||||||||||||
|
2010
|
2009
|
2010
|
2009
|
2010
|
2009
|
|||||||||||||||||||
|
As of January 1
|
(590
|
) |
(588
|
) |
(179
|
) |
(174
|
) |
(769
|
) |
(762
|
) | ||||||||||||
|
Plan expense recognized in income statement
|
(71
|
) |
(78
|
) |
(15
|
) |
(13
|
) |
(86
|
) |
(91
|
) | ||||||||||||
|
Actuarial losses
|
(155
|
) |
(7
|
) |
(11
|
) |
(4
|
) |
(166
|
) |
(11
|
) | ||||||||||||
|
Exchange differences
|
(16
|
) |
3
|
-
|
1
|
(16
|
) |
4
|
||||||||||||||||
|
Contributions paid
|
76
|
75
|
11
|
11
|
87
|
86
|
||||||||||||||||||
|
Other
|
(26
|
) |
5
|
(2
|
) |
-
|
(28
|
) |
5
|
|||||||||||||||
|
Net plan obligations as of December 31
|
(782
|
) |
(590
|
) |
(196
|
) |
(179
|
) |
(978
|
) |
(769
|
) | ||||||||||||
|
Net plan surpluses recognized in non-current assets
|
48
|
64
|
||||||||||||||||||||||
|
Net plan obligations recognized in non-current liabilities
|
(1,026
|
) |
(833
|
) | ||||||||||||||||||||
|
(1)
|
Includes amounts for immaterial defined benefit and OPEB plans that are not included in the detailed analysis below.
|
Analysis of material defined benefit plans
The net defined benefit surpluses (obligations) of the material defined benefit plans recognized in the statement of financial position were as follows:
|
Funded
|
Unfunded (1)
|
OPEB
|
Total
|
|||||||||||||||||||||||||||||
|
As of December 31,
|
2010
|
2009
|
2010
|
2009
|
2010
|
2009
|
2010
|
2009
|
||||||||||||||||||||||||
|
Present value of plan obligations
|
(4,883
|
) |
(4,436
|
) |
(281
|
) |
(263
|
) |
(186
|
) |
(172
|
) |
(5,350
|
) |
(4,871
|
) | ||||||||||||||||
|
Fair value of plan assets
|
4,586
|
4,261
|
-
|
-
|
-
|
-
|
4,586
|
4,261
|
||||||||||||||||||||||||
|
(297
|
) |
(175
|
) |
(281
|
) |
(263
|
) |
(186
|
) |
(172
|
) |
(764
|
) |
(610
|
) | |||||||||||||||||
|
Unrecognized plan assets (2)
|
(172
|
) |
(127
|
) |
-
|
-
|
-
|
-
|
(172
|
) |
(127
|
) | ||||||||||||||||||||
|
Net plan obligations
|
(469
|
) |
(302
|
) |
(281
|
) |
(263
|
) |
(186
|
) |
(172
|
) |
(936
|
) |
(737
|
) | ||||||||||||||||
|
Net plan surpluses
|
48
|
64
|
-
|
-
|
-
|
-
|
48
|
64
|
||||||||||||||||||||||||
|
Net plan obligations
|
(517
|
) |
(366
|
) |
(281
|
) |
(263
|
) |
(186
|
) |
(172
|
) |
(984
|
) |
(801
|
) | ||||||||||||||||
|
(1)
|
The unfunded pension plans referred to above consist primarily of supplemental executive retirement plans (“SERPs”) for eligible employees.
|
|
(2)
|
Unrecognized plan assets represent the plan surpluses deemed not recoverable as the Company cannot unilaterally reduce future contributions in order to utilize the surplus. These amounts are not included in the statement of financial position.
|
The following summarizes the activity in material defined benefit pension and OPEB plans:
|
Present Value of Defined Benefit Obligation
|
||||||||||||||||||||||||||||||||
|
Funded
|
Unfunded
|
OPEB
|
Total
|
|||||||||||||||||||||||||||||
|
2010
|
2009
|
2010
|
2009
|
2010
|
2009
|
2010
|
2009
|
|||||||||||||||||||||||||
|
Opening defined benefit obligation
|
(4,436
|
) |
(3,922
|
) |
(263
|
) |
(253
|
) |
(172
|
) |
(166
|
) |
(4,871
|
) |
(4,341
|
) | ||||||||||||||||
|
Current service cost
|
(80
|
) |
(75
|
) |
(4
|
) |
(5
|
) |
(2
|
) |
(2
|
) |
(86
|
) |
(82
|
) | ||||||||||||||||
|
Interest cost
|
(247
|
) |
(234
|
) |
(15
|
) |
(15
|
) |
(10
|
) |
(10
|
) |
(272
|
) |
(259
|
) | ||||||||||||||||
|
Actuarial losses
|
(357
|
) |
(113
|
) |
(13
|
) |
(3
|
) |
(11
|
) |
(4
|
) |
(381
|
) |
(120
|
) | ||||||||||||||||
|
Contributions by employees
|
(8
|
) |
(9
|
) |
-
|
-
|
-
|
-
|
(8
|
) |
(9
|
) | ||||||||||||||||||||
|
Benefits paid
|
164
|
155
|
15
|
15
|
10
|
11
|
189
|
181
|
||||||||||||||||||||||||
|
Exchange differences
|
104
|
(237
|
) |
1
|
(7
|
) |
(1
|
) |
(1
|
) |
104
|
(245
|
) | |||||||||||||||||||
|
Other
|
(23
|
) |
(1
|
) |
(2
|
) |
5
|
-
|
-
|
(25
|
) |
4
|
||||||||||||||||||||
|
Closing defined benefit obligation
|
(4,883
|
) |
(4,436
|
) |
(281
|
) |
(263
|
) |
(186
|
) |
(172
|
) |
(5,350
|
) |
(4,871
|
) | ||||||||||||||||
Thomson Reuters Annual Report 2010
123
|
Fair Value of Plan Assets
|
Funded
|
Unfunded
|
OPEB
|
Total
|
||||||||||||||||||||||||||||
|
2010
|
2009
|
2010
|
2009
|
2010
|
2009
|
2010
|
2009
|
|||||||||||||||||||||||||
|
Opening fair value of plan assets
|
4,261
|
3,698
|
-
|
-
|
-
|
-
|
4,261
|
3,698
|
||||||||||||||||||||||||
|
Expected return (1)
|
279
|
257
|
-
|
-
|
-
|
-
|
279
|
257
|
||||||||||||||||||||||||
|
Actuarial gains (1)
|
271
|
135
|
-
|
-
|
-
|
-
|
271
|
135
|
||||||||||||||||||||||||
|
Contributions by employer
|
59
|
57
|
15
|
15
|
10
|
11
|
84
|
83
|
||||||||||||||||||||||||
|
Contributions by employees
|
8
|
9
|
-
|
-
|
-
|
-
|
8
|
9
|
||||||||||||||||||||||||
|
Benefits paid
|
(164
|
) |
(155
|
) |
(15
|
) |
(15
|
) |
(10
|
) |
(11
|
) |
(189
|
) |
(181
|
) | ||||||||||||||||
|
Exchange differences
|
(127
|
) |
260
|
-
|
-
|
-
|
-
|
(127
|
) |
260
|
||||||||||||||||||||||
|
Other
|
(1
|
) |
-
|
-
|
-
|
-
|
-
|
(1
|
) |
-
|
||||||||||||||||||||||
|
Closing fair value of plan assets
|
4,586
|
4,261
|
-
|
-
|
-
|
-
|
4,586
|
4,261
|
||||||||||||||||||||||||
|
(1)
|
Actuarial gains and losses include the difference between the expected and actual return on plan assets. The expected return on assets represents the projected increase in the fair value of plan assets due to investment returns. The actual return on plan assets for the year ended December 31, 2010 was a gain of $550 million (2009: gain of $392 million).
|
The weighted average duration of the plan obligations were 17 years (2009: 17) and 22 years (2009: 20) for the Thomson Reuters Group Pension Plan and the Reuters Pension Fund, respectively.
For funded plans, the major categories of plan assets as a percentage of total plan assets were as follows:
|
As of December 31,
|
||||||||
|
2010
|
2009
|
|||||||
|
Equity
|
40
|
% |
42
|
% | ||||
|
Bonds
|
54
|
% |
53
|
% | ||||
|
Property
|
3
|
% |
3
|
% | ||||
|
Other
|
3
|
% |
2
|
% | ||||
|
Total
|
100
|
% |
100
|
% | ||||
Plan assets are invested to satisfy the fiduciary obligation to adequately secure benefits and to minimize the Company’s long-term contributions to the plans. As of December 31, 2010 and 2009, there were no Thomson Reuters securities held in the Company’s pension plans’ assets.
The following summarizes the history of plan obligations, plan assets and experience adjustments:
|
As of December 31,
|
2010
|
2009
|
2008
|
|||||||||||||||||||||||||||||||||||||||||||||
|
Funded
|
Unfunded
|
OPEB
|
Total
|
Funded
|
Unfunded
|
OPEB
|
Total
|
Funded
|
Unfunded
|
OPEB
|
Total
|
|||||||||||||||||||||||||||||||||||||
|
Present value of plan obligations
|
(4,883 | ) | (281 | ) | (186 | ) | (5,350 | ) | (4,436 | ) | (263 | ) | (172 | ) | (4,871 | ) | (3,922 | ) | (253 | ) | (166 | ) | (4,341 | ) | ||||||||||||||||||||||||
|
Fair value of plan assets
|
4,586 | - | - | 4,586 | 4,261 | - | - | 4,261 | 3,698 | - | - | 3,698 | ||||||||||||||||||||||||||||||||||||
|
Deficit
|
(297 | ) | (281 | ) | (186 | ) | (764 | ) | (175 | ) | (263 | ) | (172 | ) | (610 | ) | (224 | ) | (253 | ) | (166 | ) | (643 | ) | ||||||||||||||||||||||||
|
Year ended December 31,
|
2010
|
2009
|
2008
|
|||||||||||||||||||||||||||||||||||||||||||||
|
Funded
|
Unfunded
|
OPEB
|
Total
|
Funded
|
Unfunded
|
OPEB
|
Total
|
Funded
|
Unfunded
|
OPEB
|
Total
|
|||||||||||||||||||||||||||||||||||||
|
Experience gains (losses) on plan obligations
|
(22 | ) | 1 | - | (21 | ) | (2 | ) | 5 | 4 | 7 | (50 | ) | 3 | 10 | (37 | ) | |||||||||||||||||||||||||||||||
|
Experience gains (losses) on plan assets
|
271 | - | - | 271 | 135 | - | - | 135 | (578 | ) | - | - | (578 | ) | ||||||||||||||||||||||||||||||||||
Contributions
In 2010, the Company made special contributions of $12 million (2009: $7 million) to the Reuters Supplementary Pension Plan (“SPS”) following discussion with plan Trustees. In 2009, the Company also made special contributions of $4 million to the Reuters Pension Fund. In 2011, the Company expects to contribute approximately $77 million to all its plans in accordance with normal funding policy, of which $50 million relates to the normal funding policy of funded plans, and the remainder relates to claims arising under unfunded plans. Additionally, the Company does not anticipate having to make material special contributions to its pension plans in 2011. From time to time, the Company may elect to make voluntary contributions in order to improve the funded status of the plans. Relative to certain plans, the Trustees have the right to call for special valuations, which could result in an unexpected contribution. No such valuation has been called for as of this date. Because of the ability of the trustees to call for interim valuations for certain plans, as well as market driven changes that the Company cannot predict, the Company could be required to make contributions in the future that differ significantly from its estimates.
Thomson Reuters Annual Report 2010
124
Actuarial assumptions
The weighted average actuarial assumptions were as follows:
| Funded | Unfunded | OPEB | ||||||||||||||||||||||
|
As of December 31,
|
2010
|
2009
|
2010
|
2009
|
2010
|
2009
|
||||||||||||||||||
|
Discount rate
|
5.32 | % | 5.72 | % | 5.41 | % | 5.94 | % | 5.05 | % | 5.65 | % | ||||||||||||
|
Inflation assumption
|
3.33 | % | 3.03 | % | 2.73 | % | 2.73 | % | - | - | ||||||||||||||
|
Rate of increase in salaries
|
3.91 | % | 3.86 | % | 3.60 | % | 4.78 | % | 3.50 | % | 3.50 | % | ||||||||||||
|
Rate of increase in pensions in payment
|
3.25 | % | 3.17 | % | 3.40 | % | 3.30 | % | - | - | ||||||||||||||
|
Medical cost trend
|
- | - | - | - | 7.53 | % | 8.01 | % | ||||||||||||||||
|
Expected rate of return on assets
|
6.82 | % | 6.81 | % | - | - | - | - | ||||||||||||||||
Discount rate
The discount rate was selected based on a review of current market interest rates of high-quality, fixed-rate debt securities adjusted to reflect the duration of expected future cash outflows for pension benefit payments. Because the Company has a relatively young workforce, the expected future cash outflows for its plans tend to be of longer duration than the bond indices reviewed. Therefore, the discount rate used for the Company’s plans tends to be higher than these benchmark rates. To estimate the discount rate, the Company’s actuary constructed a hypothetical yield curve that represented yields on high quality zero-coupon bonds with durations that mirrored the expected payment stream of the benefit obligation. For the Thomson Reuters Group Pension Plan and Reuters Pension Fund, a 0.25% increase or decrease in the discount rate would have decreased or increased the defined benefit obligation by approximately $155 million as of December 31, 2010.
Expected rate of return on assets
The Company must make assumptions about the expected long-term rate of return on plan assets, but there is no assurance that a plan will be able to earn the assumed rate of return. In determining the long-term rate of return assumption, the Company considers historical returns, input from investment advisors and its actuary’s simulation model of expected long-term rates of return assuming the Company’s targeted investment portfolio mix. For the Thomson Reuters Group Pension Plan and Reuters Pension Fund, a 0.25% increase or decrease in the expected rate of return on assets would decrease or increase pension expense by approximately $8 million in 2011.
Medical cost trend
The medical cost trend is based on the Company’s actuarial medical claims experience and future projections of medical costs. The average medical cost trend rate used was 7.5% for 2010, which is reduced ratably to 5% in 2016. A 1% increase or decrease in the trend rate would have resulted in an increase or decrease in the benefit obligation for post-retirement benefits of approximately $17 million at December 31, 2010 and an increase or decrease in the service and interest costs of approximately $1 million in 2010.
Mortality assumptions
The mortality assumptions used to assess the defined benefit obligation for the Thomson Reuters Group Pension Plan and the Reuters Pension Fund as of December 31, 2010 are based on the UP94 Generational Table and the 00 Series Tables issued by the Continuous Mortality Investigation Bureau with allowance for projected longevity improvements and adjustment for the medium cohort effect, respectively.
The following table illustrates the life expectation in years of an average plan participant retiring at age 65 as of December 31, 2010 and 2009 and a plan participant at age 40 as of December 31, 2010 and 2009 retiring 25 years later at age 65 under the mortality assumptions used.
|
December 31, 2010
|
Life Expectation in Years
|
||||
|
Male
|
Female
|
||||
|
Employee retiring as of December 31, 2010 at age 65
|
21
|
23
|
|||
|
Employee age 40 as of December 31, 2010 retiring at age 65
|
22
|
24
|
|||
|
December 31, 2009
|
Life Expectation in Years
|
||||
|
Male
|
Female
|
||||
|
Employee retiring as of December 31, 2009 at age 65
|
21
|
23
|
|||
|
Employee age 40 as of December 31, 2009 retiring at age 65
|
22
|
23
|
|||
For the Thomson Reuters Group Pension Plan and the Reuters Pension Fund, an increase in life expectancy of one year across all age groups would result in a $65 million increase in the defined benefit obligation as of December 31, 2010.
Thomson Reuters Annual Report 2010
125
Analysis of income and expense
The following summarizes income and expense activity for material defined benefit plans:
|
Income Statement
|
Funded
|
Unfunded
|
OPEB
|
Total
|
||||||||||||||||||||||||||||
|
Year ended December 31,
|
2010
|
2009
|
2010
|
2009
|
2010
|
2009
|
2010
|
2009
|
||||||||||||||||||||||||
|
Current service cost
|
80 | 75 | 4 | 5 | 2 | 2 | 86 | 82 | ||||||||||||||||||||||||
|
Interest cost
|
247 | 234 | 15 | 15 | 10 | 10 | 272 | 259 | ||||||||||||||||||||||||
|
Expected gain on plan assets
|
(279 | ) | (257 | ) | - | - | - | - | (279 | ) | (257 | ) | ||||||||||||||||||||
|
Defined benefit plan expense
|
48 | 52 | 19 | 20 | 12 | 12 | 79 | 84 | ||||||||||||||||||||||||
|
Statement of Comprehensive Income
|
Funded
|
Unfunded
|
OPEB
|
Total
|
||||||||||||||||||||||||||||
|
Year ended December 31,
|
2010
|
2009
|
2010
|
2009
|
2010
|
2009
|
2010
|
2009
|
||||||||||||||||||||||||
|
Actuarial losses (gains)
|
86 | (22 | ) | 13 | 3 | 11 | 4 | 110 | (15 | ) | ||||||||||||||||||||||
|
Effect of asset ceiling
|
52 | 25 | - | - | - | - | 52 | 25 | ||||||||||||||||||||||||
|
Total recognized in other comprehensive income before taxation
|
138 | 3 | 13 | 3 | 11 | 4 | 162 | 10 | ||||||||||||||||||||||||
|
Accumulated Comprehensive Income
|
Funded
|
Unfunded
|
OPEB
|
Total
|
||||||||||||||||||||||||||||
|
2010
|
2009
|
2010
|
2009
|
2010
|
2009
|
2010
|
2009
|
|||||||||||||||||||||||||
|
Balance of actuarial losses (gains) at January 1
|
542 | 564 | 1 | (2 | ) | (13 | ) | (17 | ) | 530 | 545 | |||||||||||||||||||||
|
Net actuarial losses (gains) recognized in the year
|
86 | (22 | ) | 13 | 3 | 11 | 4 | 110 | (15 | ) | ||||||||||||||||||||||
|
Balance of actuarial losses (gains) at December 31
|
628 | 542 | 14 | 1 | (2 | ) | (13 | ) | 640 | 530 | ||||||||||||||||||||||
|
Balance of asset ceiling at January 1
|
46 | 21 | - | - | - | - | 46 | 21 | ||||||||||||||||||||||||
|
Effects of the asset ceiling in the year
|
52 | 25 | - | - | - | - | 52 | 25 | ||||||||||||||||||||||||
|
Balance of asset ceiling at December 31
|
98 | 46 | - | - | - | - | 98 | 46 | ||||||||||||||||||||||||
|
Total accumulated comprehensive income at December 31
|
726 | 588 | 14 | 1 | (2 | ) | (13 | ) | 738 | 576 | ||||||||||||||||||||||
Defined contribution plans
The Company sponsors various defined contribution savings plans that provide for company-matching contributions. Total expense related to defined contribution plans was $132 million in 2010 (2009: $128 million), which approximates the cash outlays related to the plans.
NOTE 27: SUPPLEMENTAL CASH FLOW INFORMATION
Details of “Other” in the statement of cash flow are as follows:
|
Year ended December 31,
|
||||||||
|
2010
|
2009
|
|||||||
|
Non-cash employee benefit charges
|
206 | 214 | ||||||
|
Losses from redemption of debt securities
|
62 | 35 | ||||||
|
Other
|
165 | 41 | ||||||
| 433 | 290 | |||||||
Details of “Changes in working capital and other items” are as follows:
|
Year ended December 31,
|
||||||||
|
2010
|
2009
|
|||||||
|
Trade and other receivables
|
(43 | ) | 126 | |||||
|
Prepaid expenses and other current assets
|
2 | 35 | ||||||
|
Other financial assets
|
9 | 4 | ||||||
|
Payables, accruals and provisions
|
48 | (142 | ) | |||||
|
Deferred revenue
|
89 | (77 | ) | |||||
|
Other financial liabilities
|
- | (6 | ) | |||||
|
Income taxes
|
(12 | ) | (26 | ) | ||||
|
Other
|
(148 | ) | (133 | ) | ||||
| (55 | ) | (219 | ) | |||||
Thomson Reuters Annual Report 2010
126
NOTE 28: ACQUISITIONS
Acquisitions primarily comprise the purchase of businesses that are integrated into existing operations to broaden the Company’s range of offerings to customers as well as its presence in global markets.
Acquisition activity
The number of acquisitions completed, and the related cash consideration, during 2010 and 2009 were as follows:
|
Year ended December 31,
|
||||||||||||||||
|
2010
|
2009
|
|||||||||||||||
|
Number of transactions
|
Cash
consideration(1)
|
Number of transactions
|
Cash
consideration(1)
|
|||||||||||||
|
Businesses and identifiable intangible assets acquired
|
26 | 592 | 31 | 347 | ||||||||||||
|
Investments in businesses
|
1 | 20 | - | 2 | ||||||||||||
| 27 | 612 | 31 | 349 | |||||||||||||
|
(1)
|
Cash consideration is net of cash acquired of $250 million and $19 million for the year ended December 31, 2010 and 2009, respectively.
|
Purchase price allocation
Each business combination has been accounted for using the acquisition method and the results of acquired businesses are included in the consolidated financial statements from the dates of acquisition. Purchase price allocations related to certain acquisitions may be subject to adjustment pending completion of the final valuations.
The details of net assets acquired were as follows:
|
2010
|
2009
|
|||||||
|
Cash and cash equivalents
|
250 | 19 | ||||||
|
Trade and other receivables (1)
|
43 | 23 | ||||||
|
Prepaid expenses and other current assets
|
111 | 3 | ||||||
|
Current assets
|
404 | 45 | ||||||
|
Computer hardware and other property, net
|
6 | 8 | ||||||
|
Computer software, net
|
57 | 55 | ||||||
|
Other identifiable intangible assets (see note 17)
|
583 | 171 | ||||||
|
Other financial assets and other non-current assets (2)
|
(88 | ) | - | |||||
|
Total assets
|
962 | 279 | ||||||
|
Payables, accruals and provisions
|
(143 | ) | (21 | ) | ||||
|
Deferred revenue
|
(64 | ) | (33 | ) | ||||
|
Current liabilities
|
(207 | ) | (54 | ) | ||||
|
Provisions and other non-current liabilities
|
(8 | ) | (20 | ) | ||||
|
Financial liabilities
|
(52 | ) | - | |||||
|
Deferred tax
|
(135 | ) | (6 | ) | ||||
|
Total liabilities
|
(402 | ) | (80 | ) | ||||
|
Net assets acquired
|
560 | 199 | ||||||
|
Retained earnings (3)
|
(125 | ) | - | |||||
|
Non-controlling interests (3)
|
(291 | ) | - | |||||
|
Goodwill
|
698 | 167 | ||||||
|
Total
|
842 | 366 | ||||||
|
(1)
|
The gross contractual amount of trade receivables due is $44 million, of which $1 million is expected to be uncollectible.
|
|
(2)
|
Primarily represents elimination of the carrying value of the equity interest in Tradeweb New Markets. See “Tradeweb transaction” within this note 28.
|
|
(3)
|
Relates to the exchange of equity interests to form a single Tradeweb entity. See “Tradeweb transaction” within this note 28.
|
The excess of the purchase price over the net tangible and identifiable intangible assets acquired and assumed liabilities, less the amounts allocated to non-controlling interests and retained earnings was recorded as goodwill and reflects the synergies and the value of acquired work force. The majority of goodwill is not expected to be deductible for tax purposes.
Thomson Reuters Annual Report 2010
127
The following provides a brief description of major acquisitions completed during 2010 (1) and 2009:
|
Date
|
Company (2)
|
Acquiring segment
|
Description
|
|
|
November 2010
|
GeneGo
|
Healthcare & Science
|
A provider of biology and disease information, analytics, and decision support solutions for pharmaceutical research and development
|
|
|
November 2010
|
Pangea3
|
Legal
|
A provider of legal process outsourcing services
|
|
|
November 2010
|
Tradeweb
New Markets
|
Markets
|
A multi-asset class over-the-counter trading platform
|
|
|
October 2010
|
Serengeti
|
Legal
|
A provider of electronic billing and matter management systems for corporate legal departments
|
|
|
August 2010
|
Canada
Law Book
|
Legal
|
A Canadian legal publisher
|
|
|
June 2010
|
Complinet
|
Legal
|
A provider of global compliance information solutions for financial services institutions and their advisors
|
|
|
June 2010
|
Point Carbon
|
Markets
|
A provider of essential trading analytics, news and content for the energy and environmental markets
|
|
|
May 2010
|
Revista dos Tribunais
|
Legal
|
A Brazilian legal publisher
|
|
|
February 2010
|
Aegisoft
|
Markets
|
A provider of electronic trading solutions and testing tools
|
|
|
December 2009
|
Sabrix
|
Tax & Accounting
|
A provider of transaction tax management software applications and related services
|
|
(1)
|
Including cash acquired, these 2010 acquisitions represented approximately 83% of total cash consideration.
|
|
(2)
|
Transactions completed through acquisition of all equity interests or selected net assets of the named business, except Tradeweb New Markets (see “Tradeweb transaction” within this note 28).
|
Tradeweb transaction
In January 2008, the Company formed a partnership with a consortium of global securities dealers (the “Consortium”) to further expand Tradeweb, its over-the-counter, multi-asset class, online marketplace that is within the Markets division. Tradeweb was structured as two separate entities, Tradeweb Markets (“TWM”) and Tradeweb New Markets (“TWNM”), in which the Company had ownership interests of approximately 85% and 20%, respectively, with the remaining interests owned by the Consortium. In November 2010, in order to better position the businesses for long-term growth opportunities, the two entities completed a transaction to form a single Tradeweb entity (“Tradeweb”). Upon completion of the transaction, the Company owns the majority of the equity interests of Tradeweb and the Consortium holds a non-controlling interest.
The transaction was accomplished through the exchange of equity interests and the receipt of $30 million in cash consideration. If Tradeweb achieves certain performance milestones in 2011 and 2012, the former owners of TWNM will receive additional equity interests in Tradeweb that would increase the proportion of the Consortium’s non-controlling equity interests in Tradeweb.
The transaction was accounted for as an acquisition of TWNM by TWM. The Company re-measured its pre-acquisition investment in TWNM of 20%, resulting in a pre-tax gain of $18 million. The gain was reported within “Other operating (losses) gains, net” in the income statement as the Company acquired a controlling ownership interest in TWNM as a result of the transaction.
The exchange of equity interests resulted in an increase to non-controlling interests of $291 million and an increase in retained earnings of $125 million.
|
|
●
|
The portion of the change in the non-controlling interest arising from the acquisition of TWNM was measured at fair value as of the date of the transaction applying the income approach, market approach and comparable transaction approach;
|
|
|
●
|
The change in the Company’s ownership interest in TWM did not result in a change in control and therefore was accounted for as an equity transaction measured at historical book value and recorded in retained earnings; and
|
|
|
●
|
The contingent consideration was measured at fair value at the date of the transaction, a portion of which was recorded to retained earnings and a portion recorded as a financial liability.
|
As of the completion of the transaction, the Company fully consolidates the combined entity in its financial statements.
Thomson Reuters Annual Report 2010
128
Other
The revenues and operating profit of acquired businesses since the date of acquisition were not material to the Company’s results of operations.
In 2010, $26 million of directly attributable acquisition-related transaction costs were expensed within the income statement as part of “Other operating (losses) gains, net”.
NOTE 29: CONTINGENCIES, COMMITMENTS AND GUARANTEES
Lawsuits and legal claims
In November 2009, the European Commission initiated an investigation relating to the use of the Company’s Reuters Instrument Codes (“RIC symbols”). RIC symbols help financial professionals retrieve news and information on financial instruments (such as prices and other data on stocks, bonds, currencies and commodities). The Company is fully cooperating with the investigation. The Company does not believe that it has engaged in any anti-competitive activity related to RIC symbols.
In addition to the matter described above, the Company is engaged in various legal proceedings and claims that have arisen in the ordinary course of business. The outcome of all of the proceedings and claims against the Company, including the matter described above, is subject to future resolution, including the uncertainties of litigation. Based on information currently known to the Company and after consultation with outside legal counsel, management believes that the probable ultimate resolution of any such proceedings and claims, individually or in the aggregate, will not have a material adverse effect on the financial condition of the Company, taken as a whole.
Uncertain tax positions
The Company is subject to taxation in numerous jurisdictions. There are many transactions and calculations during the course of business for which the ultimate tax determination is uncertain. The Company maintains provisions for uncertain tax positions that it believes appropriately reflect its risk. These provisions are made using the best estimate of the amount expected to be paid based on a qualitative assessment of all relevant factors. The Company reviews the adequacy of these provisions at the end of the reporting period. In April 2008, upon the completion of a routine tax audit for the years 2003 to 2005, the Internal Revenue Service notified the Company that it would challenge certain positions taken on its tax returns. The IRS subsequently challenged similar positions on the Company’s tax returns for 2006 and 2007. The IRS has since informed the Company that it will no longer challenge these positions for the years 2003 to 2007, but that it will challenge other positions for the years 2006 and 2007. It is possible that at some future date, liabilities in excess of the Company’s provisions could result from audits by, or litigation with, the IRS or other relevant taxing authorities. Management believes that such additional liabilities would not have a material adverse impact on the Company’s financial condition taken as a whole.
Leases
The Company enters into operating leases in the ordinary course of business, primarily for real property and equipment. Payments for these leases are contractual obligations as scheduled per each agreement. Operating lease payments in 2010 were $393 million (2009 – $373 million). The future aggregate minimum lease payments under non-cancellable operating leases are as follows:
|
December 31,
|
||||
|
2010
|
||||
|
2011
|
329 | |||
|
2012
|
274 | |||
|
2013
|
233 | |||
|
2014
|
186 | |||
|
2015
|
145 | |||
|
2016 and thereafter
|
425 | |||
| 1,592 | ||||
With certain leases, the Company guarantees a portion of the residual value loss, if any, incurred by the lessors in disposing of the assets, or in restoring a property to a specified condition after completion of the lease period. The liability associated with these restorations is recorded within “Provisions and other non-current liabilities” in the statement of financial position.
The total of future minimum sublease payments to be received under non-cancellable subleases was $68 million at December 31, 2010. Sublease payments received in 2010 were $12 million (2009: $9 million).
Thomson Reuters Annual Report 2010
129
Business combinations and investments
The Company has obligations to pay additional consideration for prior acquisitions, typically based upon performance measures contractually agreed at the time of purchase. The Company does not believe that additional payments in connection with these transactions would have a material impact on the consolidated financial statements.
In certain disposition agreements, the Company guarantees to the purchaser the recoverability of certain assets or limits on certain liabilities. The Company does not believe, based upon current facts and circumstances, that additional payments in connection with these transactions would have a material impact on the consolidated financial statements.
Unconditional purchase obligations
The Company has various obligations for materials, supplies and services incidental to the ordinary conduct of business. The future unconditional purchase obligations are as follows:
|
December 31,
|
||||
|
2010
|
||||
|
2011
|
693 | |||
|
2012
|
543 | |||
|
2013
|
446 | |||
|
2014
|
365 | |||
|
2015
|
255 | |||
|
2016 and thereafter
|
137 | |||
| 2,439 | ||||
NOTE 30: RELATED PARTY TRANSACTIONS
As of December 31, 2010, Woodbridge beneficially owned approximately 55% of the Company’s shares.
Transactions with Woodbridge
From time to time, in the normal course of business, Woodbridge and certain of its affiliates purchase some of the Company’s product and service offerings. These transactions are negotiated at arm’s length on standard terms, including price, and are not significant to the Company’s results of operations or financial condition either individually or in the aggregate.
In December 2009, the Company sold a Canadian wholly owned subsidiary to a company affiliated with Woodbridge for approximately $30 million. The subsidiary had no business operations, but had accumulated losses that management did not expect to utilize against future taxable income prior to their expiry. As such, no tax benefit for the losses had been recognized in the financial statements. Under Canadian law, certain losses may only be transferred to related companies, such as those affiliated with Woodbridge. A gain of $30 million was recorded within “Other operating (losses) gains, net” in the consolidated income statement. In connection with this transaction, an independent accounting firm retained by the board of directors’ Corporate Governance Committee provided an opinion based on its experience as professional business valuators that the sale price was not less than the fair market value of the losses and represented a reasonable negotiated price between the Company and the purchaser. After receiving the recommendation of the Corporate Governance Committee, the board of directors approved the transaction. Directors who were not considered independent because of their positions with Woodbridge refrained from deliberating and voting on the matter at both the committee and board meetings.
In the normal course of business, certain of the Company’s subsidiaries charge a Woodbridge owned company fees for various administrative services. In 2010, the total amount charged to Woodbridge for these services was approximately $126,000 (2009 - $360,000).
The Company purchases property and casualty insurance from third party insurers and retains the first $500,000 of each and every claim under the programs via the Company’s captive insurance subsidiary. Woodbridge is included in these programs and pays the Company a premium commensurate with its exposures. Premiums relating to 2010 were $67,000 (2009 - $73,000), which would approximate the premium charged by a third party insurer for such coverage.
At December 31, 2010 and 2009, the amounts receivable from Woodbridge in respect of the above transactions were negligible.
The Company maintained an agreement with Woodbridge until April 17, 2008 (the closing date of the Reuters acquisition) under which Woodbridge agreed to indemnify up to $100 million of liabilities incurred either by the Company’s current and former directors and officers or by the Company in providing indemnification to these individuals on substantially the same terms and conditions as would apply under an arm’s length, commercial arrangement. The Company was required to pay Woodbridge an annual fee of $750,000, which was less than the premium that would have been paid for commercial insurance. In 2008, the Company replaced this agreement with a conventional insurance agreement. The Company is entitled to seek indemnification from Woodbridge for any claims arising from events prior to April 17, 2008, so long as the claims are made before April 17, 2014.
Thomson Reuters Annual Report 2010
130
Transactions with affiliates and joint ventures
The Company enters into transactions with its investments in affiliates and joint ventures. These transactions involve providing or receiving services and are entered into in the normal course of business and on an arm’s length basis.
The Company and The Depository Trust & Clearing Corporation (“DTCC”) each have a 50% interest in Omgeo, a provider of trade management services. Omgeo pays the Company for use of a facility and technology and other services. For 2010, these services were valued at approximately $9 million (2009 - $10 million). At December 31, 2010 and 2009, the amount receivable from Omgeo was approximately $2 million.
The Company and Shin Nippon Hoki Shuppan K.K. each own 50% of Westlaw Japan K.K., a provider of legal information and solutions to the Japanese legal market. The Company provides the joint venture with technology and other services, which were valued at approximately $2 million for 2010 (2009 - $3 million). The amounts receivable relating to technology and other services were negligible at December 31, 2010 and 2009.
Prior to the Tradeweb transaction in November 2010 (see note 28), TWM provided services, including use of its trading platform and various back office functions, to TWNM. In 2010, the Company recognized revenues of $16 million related to these services, (2009 - $18 million). At December 31, 2009, the amount receivable from TWNM was $3 million.
In connection with the 2008 acquisition of Reuters, the Company assumed a lease agreement with 3XSQ Associates, an entity now owned by the Company and Rudin Times Square Associates LLC that was formed to build and operate the 3 Times Square property and building in New York, New York that now serves as the Company’s corporate headquarters. The Company follows the equity method of accounting for its investment in 3XSQ Associates. The lease provides the Company with over 690,000 square feet of office space until 2021 and includes provisions to terminate portions early and various renewal options. In 2010, the Company’s costs related to 3XSQ Associates were approximately $38 million for rent, taxes and other expenses (2009 - $37 million). At December 31, 2010 and 2009, the amounts payable to 3XSQ Associates were negligible.
Other transactions
In February 2010, the Company acquired Super Lawyers from an entity controlled by Vance Opperman, one of the Company’s directors, for approximately $15 million. The acquisition helps expand FindLaw’s product offerings. Mr. Opperman’s son was the CEO of the acquired business and agreed to stay on with the business through a transition period which concluded in the third quarter of 2010. The Company’s board of directors reviewed and approved the transaction. Mr. Opperman refrained from deliberating and voting on the matter.
In October 2010, the Company acquired Serengeti, a provider of electronic billing and matter management systems for corporate legal departments. As a result of a prior investment in a venture lending firm, Peter Thomson, one of the Company’s directors, may have the right to receive 10% of the purchase consideration paid by the Company. Mr. Thomson did not participate in negotiations related to the acquisition of Serengeti and refrained from deliberating and voting on the acquisition.
Compensation of Key Management Personnel
Key management personnel compensation, including directors, is as follows:
|
Year ended December 31,
|
||||||||
|
2010
|
2009
|
|||||||
|
Salaries and other benefits
|
23 | 24 | ||||||
|
Share-based payments
|
32 | 35 | ||||||
|
Total
|
55 | 59 | ||||||
Key management personnel are comprised of the Company’s directors and executive officers.
NOTE 31: SUBSEQUENT EVENTS
2011 Dividends
In February 2011, the Company’s board of directors approved a $0.08 per share increase in the annual dividend to $1.24 per common share. The next quarterly dividend of $0.31 per share is payable on March 15, 2011 to shareholders of record as of February 22, 2011.
Thomson Reuters Annual Report 2010
131
Planned divestitures
In February 2011, the Company announced its intention to sell the following Professional division businesses which are no longer fundamental to its strategy:
|
Business
|
Segment
|
Description
|
||
|
BARBRI
|
Legal
|
A provider of bar exam preparatory workshops, courses, software, lectures and other tools in the U.S.
|
||
|
Scandinavian legal, tax and accounting businesses
|
Legal and
Tax & Accounting
|
A provider of legal and regulatory products and services in Denmark and Sweden.
|
These sales are expected to be completed in the first half of 2011, and will not qualify for discontinued operations classification.
Termination of vendor agreement
In the first quarter of 2011, the Company reached agreement with a vendor to terminate an information technology (“IT”) outsourcing agreement, which had been signed by Reuters prior to the acquisition of that business. The Company and the vendor mutually terminated the agreement as the vendor was unable to provide certain services. Following a transition period with the vendor, the Company plans to fold these technology support services into existing in-house operations.
The Company expects to record total charges of approximately $100 million relating to this termination in 2011, of which the majority will be non-cash. These charges represent payments that were made to the vendor in prior periods for which the Company will receive no future value, net of amounts that are payable by the Company and the vendor in connection with the termination and subsequent transition.
Thomson Reuters Annual Report 2010
132
EXECUTIVE OFFICERS AND DIRECTORS
The following individuals are our executive officers:
|
Name
|
Age
|
Title
|
||
|
Thomas H. Glocer
|
51
|
Chief Executive Officer
|
||
|
Robert D. Daleo
|
61
|
Executive Vice President and Chief Financial Officer
|
||
|
James C. Smith
|
51
|
Chief Executive Officer, Professional Division
|
||
|
Devin N. Wenig
|
44
|
Chief Executive Officer, Markets Division
|
||
|
Deirdre Stanley
|
46
|
Executive Vice President and General Counsel
|
||
|
Stephen G. Dando
|
49
|
Executive Vice President and Chief Human Resources Officer
|
||
|
James T. Powell
|
49
|
Executive Vice President and Chief Technology Officer
|
Tom Glocer is Chief Executive Officer of Thomson Reuters. Prior to April 2008, Mr. Glocer was CEO of Reuters. He joined Reuters in 1993, holding a number of key leadership positions within the organization prior to becoming CEO in 2001. Mr. Glocer practiced law at Davis Polk & Wardwell in New York, Paris and Tokyo from 1984 to 1993. He joined the board of Reuters in 2000. Mr. Glocer serves on several academic / not-for-profit organizations and advisory councils including the American Law Institute, the Council on Foreign Relations and the International Business Council of the World Economic Forum. He is also a director of Merck & Co. Inc. He has a bachelor’s degree from Columbia University and a law degree from Yale University. Mr. Glocer resides in New York, New York, United States.
Bob Daleo is Executive Vice President and Chief Financial Officer of Thomson Reuters. Prior to April 2008, Mr. Daleo was Chief Financial Officer of Thomson. Mr. Daleo joined Thomson in 1994 and held a number of key leadership positions within the organization before becoming CFO in 1998. Mr. Daleo was a director of Thomson from 2001 to 2008. Mr. Daleo is currently a director of Equifax Inc. and serves on the board of trustees for Fordham University and the New Jersey Community Development Corporation. Mr. Daleo resides in Alpine, New Jersey, United States.
Jim Smith is Chief Executive Officer of Thomson Reuters Professional division. Prior to April 2008, Mr. Smith was Executive Vice President and Chief Operating Officer of Thomson. Mr. Smith joined Thomson in 1987 and held a number of key leadership positions within the organization, including President and Chief Executive Officer of Thomson Learning’s Academic & Reference Group and Executive Vice President, Human Resources and Administration of Thomson. Mr. Smith resides in Stamford, Connecticut, United States.
Devin Wenig is Chief Executive Officer of Thomson Reuters Markets division. Prior to April 2008, Mr. Wenig was Chief Operating Officer of Reuters. Mr. Wenig joined Reuters in 1993 and held a number of senior management positions including President, Investment Banking & Brokerage Services and President, Business Divisions. Mr. Wenig was a director of Reuters from 2003 to 2008. Mr. Wenig resides in New York, New York, United States.
Deirdre Stanley is Executive Vice President and General Counsel of Thomson Reuters. Prior to April 2008, Ms. Stanley was Senior Vice President and General Counsel of Thomson since 2002. Prior to joining Thomson in 2002, Ms. Stanley served in various senior executive positions, including Deputy General Counsel at USA Networks, Inc. and its successor companies. From 1997 through 1999, Ms. Stanley served as Associate General Counsel for GTE Corporation, where she headed the mergers and acquisitions practice group. Before GTE Corporation, Ms. Stanley practiced law at Cravath, Swaine & Moore in New York. Ms. Stanley resides in New York, New York, United States.
Stephen Dando is Executive Vice President and Chief Human Resources Officer of Thomson Reuters. Prior to April 2008, Mr. Dando was Group Human Resources Director for Reuters since 2006. Prior to joining Reuters in 2006, Mr. Dando was Director, BBC People and a member of the BBC’s Executive Committee and Executive Board for five years. Mr. Dando also held various appointments at Diageo over a 12-year period, including Global HR Director of Guinness. Mr. Dando resides in London, United Kingdom.
James Powell is Executive Vice President and Chief Technology Officer of Thomson Reuters, a position that he has held since July 2008. Previously, Mr. Powell was CTO of Thomson Reuters Markets division. In his 15 years with Reuters, Mr. Powell held a number of senior leadership positions, including CTO of its Enterprise division and Global Head of Product Development. He has also held senior leadership positions at Solace Systems, Citadel Investment Group and TIBCO Finance Technology. Mr. Powell resides in Bronxville, New York, United States.
Thomson Reuters Annual Report 2010
133
The names, municipalities and countries of residence, offices and principal occupations of our directors are shown below. Each director has been a director since the year indicated below. All of our directors have been engaged for more than five years in their present principal occupations or in other capacities within Thomson Reuters, except where noted below. Each director will continue to hold office until the next annual meeting of our shareholders or until the director resigns or a successor is elected or appointed.
|
Committee memberships
|
|||||
|
Name
|
Age
|
Audit
|
Corporate
Governance
|
Human
Resources
|
Director
Since
|
|
David Thomson, Chairman
|
53
|
|
|
|
1988
|
|
W. Geoffrey Beattie, Deputy Chairman
|
50
|
|
•
|
•
|
1998
|
|
Niall FitzGerald, KBE, Deputy Chairman
|
65
|
|
Chair
|
•
|
2008
|
|
Thomas H. Glocer
|
51
|
|
|
|
2008
|
|
Manvinder S. Banga
|
56
|
|
|
•
|
2009
|
|
Mary Cirillo
|
63
|
|
•
|
•
|
2005
|
|
Steven A. Denning
|
62
|
|
|
Chair
|
2000
|
|
Lawton W. Fitt
|
57
|
•
|
|
|
2008
|
|
Roger L. Martin
|
54
|
•
|
|
|
1999
|
|
Sir Deryck Maughan
|
63
|
|
•
|
|
2008
|
|
Ken Olisa
|
59
|
•
|
|
|
2008
|
|
Vance K. Opperman
|
68
|
Chair
|
|
|
1996
|
|
John M. Thompson
|
68
|
•
|
•
|
|
2003
|
|
Peter J. Thomson
|
45
|
|
|
|
1995
|
|
John A. Tory
|
80
|
|
|
•
|
1978
|
David Thomson is Chairman of Thomson Reuters. He is also a Chairman of Woodbridge, the Thomson family investment company, and Chairman of The Globe and Mail, Inc., a Canadian media company. Mr. Thomson is an active private investor with a focus on real estate and serves on the boards of several private companies. Mr. Thomson has a MA from Cambridge University. Mr. Thomson resides in Toronto, Ontario, Canada.
W. Geoffrey Beattie is a Deputy Chairman of Thomson Reuters. He is President and a director of Woodbridge, the Thomson family investment company. He is also a director of General Electric Company, Maple Leaf Foods Inc. and Royal Bank of Canada. In addition to his public company board memberships, Mr. Beattie is a director of The Globe and Mail, Inc., a Canadian media company. He is also a trustee of the University Health Network. Mr. Beattie has a law degree from the University of Western Ontario. Mr. Beattie resides in Toronto, Ontario, Canada.
Niall FitzGerald, KBE, is a Deputy Chairman of Thomson Reuters. He joined the Reuters board in 2003 and became Chairman in 2004, a position he held until April 2008 when Reuters was acquired. Mr. FitzGerald was Chairman and CEO of Unilever PLC, a consumer goods company, from 1996 until his retirement in October 2004. Mr. FitzGerald serves also as a member of the World Economic Forum Foundation board. He serves a number of other not-for-profit organizations and is on various advisory bodies. He has a Commerce degree from University College in Dublin and holds a number of honorary doctorates from U.S., British and Irish universities. Mr. FitzGerald resides in London, United Kingdom.
Tom Glocer is Chief Executive Officer of Thomson Reuters. Prior to April 2008, Mr. Glocer was CEO of Reuters. He joined Reuters in 1993, holding a number of key leadership positions within the organization prior to becoming CEO in 2001. Mr. Glocer practiced law at Davis Polk & Wardwell in New York, Paris and Tokyo from 1984 to 1993. He joined the board of Reuters in 2000. Mr. Glocer serves on several academic / not-for-profit organizations and advisory councils including the American Law Institute, the Council on Foreign Relations and the International Business Council of the World Economic Forum. He is also a director of Merck & Co. Inc. He has a bachelor’s degree from Columbia University and a law degree from Yale University. Mr. Glocer resides in New York, New York, United States.
Manvinder (Vindi) S. Banga joined Clayton, Dubilier & Rice, LLC as an Operating Partner based in London in June 2010. Prior to that, he held a number of senior executive positions over his 33 year career with Unilever, including President, Food, Home & Personal Care of Unilever PLC, Business Group President of Unilever’s Home and Personal Care business in Asia and Chairman and Managing Director of Hindustan Unilever Ltd. Mr. Banga is a member of the Prime Minister of India’s Council on Trade & Industry as well as several other academic boards He is also a director of Maruti Suzuki Ltd. He is a graduate of the Indian Institute of Technology (IIT), Delhi, where he completed his Bachelor of Technology in Mechanical Engineering and the IIM Ahmedabad where he obtained a post graduate degree in Management. Mr. Banga lives in London, United Kingdom.
Thomson Reuters Annual Report 2010
134
Mary Cirillo is a corporate director. Ms. Cirillo was Chair and Chief Executive Officer of Opcenter, LLC, an Internet consulting firm, from 2000 to 2003. Prior to that, she was a senior banking executive at Bankers Trust and Citibank for over 20 years. Ms. Cirillo is a member of the Advisory Board of Hudson Venture Partners, L.P., a venture capital firm, and serves on the boards of several cultural and educational organizations. She is also a director of Dealer Track Holdings Inc. and ACE Ltd. She has a BA from Hunter College. Ms. Cirillo resides in New York, New York, United States.
Steven A. Denning is Chairman of General Atlantic LLC, a private equity investment firm that focuses exclusively on investing in growth companies globally. Mr. Denning has been with General Atlantic (or its predecessor) since 1980. He serves on the boards of several cultural and educational organizations. He is also a director of Genpact Limited. He has an MBA from Stanford Business School. Mr. Denning resides in Greenwich, Connecticut, United States.
Lawton W. Fitt is a corporate director. She joined the board of Reuters in 2004. Ms. Fitt served as Secretary (CEO) of the Royal Academy of Arts in London from 2002 to March 2005. Prior to that, she was an investment banker with Goldman Sachs & Co., where she became a partner in 1994 and a managing director in 1996. She is a director of several not-for-profit organizations in addition to CIENA Corporation and The Progressive Corporation. Ms. Fitt has a bachelor’s degree from Brown University and an MBA from the University of Virginia. Ms. Fitt resides in New York, New York, United States.
Roger L. Martin is Dean of the Joseph L. Rotman School of Management at the University of Toronto, a post-secondary educational institution, a position he has held since 1998. Previously, Mr. Martin was a Director of Monitor Company, a global strategy consulting firm. Mr. Martin is Chair of the Ontario Task Force on Competitiveness, Productivity and Economic Progress and is the Director of the AIC Institute for Corporate Citizenship. He also serves on the boards of several not-for-profit organizations. He is also a director of Research in Motion Ltd. He has an MBA from Harvard University. Mr. Martin resides in Toronto, Ontario, Canada.
Sir Deryck Maughan is a Partner of Kohlberg Kravis Roberts & Co., a global asset management company. He was Chairman and Chief Executive Officer of Citigroup International until 2004 and served as Vice Chairman of the New York Stock Exchange from 1996 to 2000. Sir Deryck joined the board of Reuters in 2005. He also serves on the boards of several charitable organizations in addition to GlaxoSmithKline plc and BlackRock Inc. Sir Deryck is a graduate of King’s College, University of London and the Graduate School of Business, Stanford University. Sir Deryck resides in New York, New York, United States.
Ken Olisa is a corporate director. He joined the board of Reuters in 2004. From 1992 to 2006, Mr. Olisa was Chair and CEO of Interregnum PLC, a technology merchant bank. Prior to that, he was a senior executive for over 20 years at Wang Labs and IBM. From 1995 to 2000, Mr. Olisa was a director of Open Text Corporation. Mr. Olisa is a founder and Chairman of Restoration Partners, a boutique technology merchant bank. He serves on the boards of several U.K. not-for-profit organizations. He is also a director of European Natural Resources Corporation Plc. He has a MA from Fitzwilliam College, Cambridge. Mr. Olisa resides in Kingston, United Kingdom.
Vance K. Opperman is President and Chief Executive Officer of Key Investment, Inc., a private investment company involved in publishing and other activities. Previously, Mr. Opperman was President of West Publishing Company, an information provider of legal and business research which is now owned by Thomson Reuters. He serves on the boards of several educational and not-for-profit organizations. He is also a director of TCF Financial Corporation. He has a law degree from the University of Minnesota and practiced law for many years. Mr. Opperman resides in Minneapolis, Minnesota, United States.
John M. Thompson served as non-executive Chairman of the Board of The Toronto-Dominion Bank, a Canadian financial institution, for eight years until January 1, 2011. Prior to that, he was Vice Chairman of the Board of IBM from 2000 until 2002. Mr. Thompson also held a number of senior management positions in his career at IBM including having oversight responsibility for the company's worldwide technology, manufacturing and business strategy. He also is a director of Royal Philips Electronics N.V. and The Toronto-Dominion Bank. He is a graduate of the University of Western Ontario with a degree in Engineering Science and completed executive management programs at the Richard Ivey School at the University of Western Ontario and the Kellogg Graduate School of Business at Northwestern University. Mr. Thompson is also Chancellor of the University of Western Ontario. Mr. Thompson resides in Toronto, Ontario, Canada.
Peter J. Thomson is a Chairman of Woodbridge, the Thomson family investment company. Mr. Thomson is an active private equity investor and serves on the boards of several private companies. He has a BA from the University of Western Ontario. Mr. Thomson resides in Toronto, Ontario, Canada.
John A. Tory is a director of Woodbridge, the Thomson family investment company. He was President of Woodbridge from 1973 to 1998 and Deputy Chairman of Thomson from 1978 to 1997. Mr. Tory has a law degree from the University of Toronto. Mr. Tory resides in Toronto, Ontario, Canada.
Thomson Reuters Annual Report 2010
135
AUDIT COMMITTEE
The Audit Committee comprises Vance K. Opperman (Chair), Lawton W. Fitt, Roger L. Martin, Ken Olisa and John M. Thompson. All members of the Audit Committee are financially literate in accordance with applicable Canadian and U.S. securities rules. Our Audit Committee does not include an individual who qualifies as an “audit committee financial expert” (within the meaning of applicable SEC rules) or meets applicable tests for accounting or related financial management expertise within the meaning of NYSE listing standards. However, we consider that, collectively, the members of the Audit Committee have the requisite skills and experience to properly discharge their responsibilities. The board will consider these qualifications in future nominations to the board and appointments to the Audit Committee.
Biographies for the members of the Audit Committee are provided above.
PRINCIPAL ACCOUNTANT FEES AND SERVICES
The following table sets forth fees related to services rendered by PricewaterhouseCoopers LLP and its affiliates in 2010 and 2009:
|
(in millions of U.S. dollars)
|
2010
|
2009
|
||||||
|
Audit fees
|
$ | 20.3 | $ | 22.9 | ||||
|
Audit-related fees
|
2.5 | 2.8 | ||||||
|
Tax fees
|
9.2 | 10.2 | ||||||
|
All other fees
|
0.8 | 0.9 | ||||||
|
Total
|
$ | 32.8 | $ | 36.8 | ||||
The following are descriptions of fees for services rendered by PricewaterhouseCoopers LLP in 2010 and 2009.
Audit Fees
These audit fees were for professional services rendered for the audits of consolidated financial statements, reviews of interim financial statements included in periodic reports, audits related to internal control over financial reporting, and services that generally only the independent auditors can reasonably provide, such as comfort letters, statutory audits, consents, and assistance and review of documents filed with securities regulatory authorities.
Audit-related Fees
These audit-related fees were for assurance and related services that are reasonably related to the performance of the audit or review of the financial statements and are not reported under the “audit fees” category above. These services included advisory services related to our company’s 2009 conversion from Canadian GAAP to IFRS, audits of various employee benefit plans, transaction due diligence, subsidiary audits and other services related to acquisitions and dispositions.
Tax Fees
Tax fees were for tax compliance, tax advice and tax planning. These services included the preparation and review of corporate and expatriate tax returns, assistance with tax audits and transfer pricing matters, advisory services relating to federal, state, provincial and international tax compliance, customs and duties, and restructurings, mergers and acquisitions.
All Other Fees
Fees disclosed in the tables above under the item “all other fees” were for services other than the audit fees, audit-related fees and tax fees described above. These services included:
|
|
—
|
French translations of our financial statements, MD&A and financial information included in our prospectuses and other offering documents; and
|
|
|
—
|
Authoring content for inclusion in certain products and services.
|
Pre-Approval Policies and Procedures
The Audit Committee has adopted a policy regarding its pre-approval of all audit and permissible non-audit services provided to our company by the independent auditors.
|
|
●
|
The policy gives detailed guidance to management as to the specific types of services that have been pre-approved by the Audit Committee.
|
Thomson Reuters Annual Report 2010
136
|
|
●
|
The policy requires the Audit Committee’s specific pre-approval of all other permitted types of services that have not already been pre-approved.
|
|
|
●
|
Senior management periodically provides the Audit Committee with a summary of services provided by the independent auditors in accordance with the pre-approval policy.
|
|
|
●
|
The Audit Committee’s charter delegates to its Chair the authority to evaluate and approve engagements in the event that the need arises for approval between Audit Committee meetings. If the Chair approves any such engagements, he must report his approval decisions to the full Audit Committee at its next meeting.
|
|
|
●
|
For the year ended December 31, 2010, none of the fees of Thomson Reuters described above made use of the de minimis exception to pre-approval provisions as provided for by Rule 2-01(c)(7)(i)(C) of SEC Regulation S-X and Section 2.4 of the Canadian Securities Administrators’ Multilateral Instrument 52-110 (Audit Committees).
|
CONTROLLED COMPANY
The NYSE corporate governance listing standards require a listed company to have, among other things, solely independent directors on its compensation committee and nominating/corporate governance committee. A “controlled company” (a company of which more than 50% of the voting power is held by an individual, group or another company) is exempt from these requirements.
The board believes it is appropriate for directors affiliated with Woodbridge to serve on the Corporate Governance Committee and the HR Committee and has approved our reliance on the controlled company exemption to do so.
INDEPENDENT DIRECTORS
Under the corporate governance guidelines adopted by the board, a director is not considered independent unless the board affirmatively determines that the director has no “material relationship” with Thomson Reuters. In determining the independence of directors, the board considers all relevant facts and circumstances. In March 2011, the board conducted its annual assessment of the independence of each of its members and determined that 10 of the 15 directors (66 2/3%) serving on the board are independent. In determining independence, the board examined and relied on the applicable definitions of “independent” in the NYSE listing standards and Canadian Securities Administrators’ National Instrument 58-101. The board also reviewed the results of questionnaires completed by each director.
|
|
●
|
One of the directors (Thomas H. Glocer) is not independent because he is the CEO of Thomson Reuters.
|
|
|
●
|
Four of the directors (David Thomson, W. Geoffrey Beattie, Peter J. Thomson and John A. Tory) are considered not independent pursuant to applicable rules because they are directors and current or former executive officers of Woodbridge, the controlling shareholder of Thomson Reuters. None of these individuals is a member of the Thomson Reuters executive management team. With its substantial equity investment in Thomson Reuters, Woodbridge considers that its interests as a shareholder are aligned with those of all other shareholders.
|
|
|
●
|
The remaining 10 directors are independent.
|
In determining the independence of directors, the board also considers that in the normal course of business, we provide services to, and receive services from, companies with which some of the independent directors are affiliated. For example, various in-house legal departments of a number of these companies subscribe to our Westlaw service. Based on the facts and circumstances of each such instance, the board determined in March 2011 that these relationships were immaterial.
In particular, the board acknowledged that Mr. Thompson has been a director of a company that Thomson Reuters has a relationship with, but determined that this relationship was not material and did not preclude a finding of independence. Mr. Thompson was the non-executive independent Chairman of the board of The Toronto-Dominion Bank until January 1, 2011. In the normal course of business, we have a banking relationship with The Toronto-Dominion Bank and one of the bank’s affiliates has served as a dealer for our recent offerings of debt securities in the United States and Canada.
PRESIDING DIRECTORS AT MEETINGS OF NON-MANAGEMENT AND INDEPENDENT DIRECTORS
In 2010, the board initiated the practice of beginning each in-person meeting with an “in-camera” session with the CEO, but no other members of management, before the start of each board meeting. This is intended to give Mr. Glocer an opportunity to discuss his objectives for the day’s meeting, and for directors to express preliminary observations based on their prior review of meeting materials. This permits a more effective use of time in the board meeting. As has been the board’s established practice, a similar session is then typically held with Mr. Glocer towards the end of the meeting, followed by a meeting of the board without Mr. Glocer. Each of the board’s committees also concludes its meetings “in-camera” with a period of time for discussion without Mr. Glocer or members of management present.
Thomson Reuters Annual Report 2010
137
In addition, at least once each year, the board meets without the CEO and without the directors affiliated with Woodbridge. These meetings of the independent directors, which follow a regularly scheduled board meeting, are chaired by the Chair of the Corporate Governance Committee. The Chair of the Corporate Governance Committee develops the agenda for these meetings, although discussion is not limited to it. The agenda generally addresses any issues that might be specific to a public corporation with a controlling shareholder. The Chair of the Corporate Governance Committee reports to the Chairman on the substance of these meetings to the extent that action is appropriate or required and is available for consultation with the independent directors as required. One such meeting of the independent directors took place in 2010 and was presided over by Niall FitzGerald.
CODE OF BUSINESS CONDUCT AND ETHICS
Our Code of Business Conduct and Ethics applies to all employees, directors and officers, including our CEO, CFO and Controller. All employees, directors and officers are required to submit an acknowledgment that they have received and read a copy of the Code and understand their obligations to comply with the principles and policies outlined in it. In an effort to promote further a culture of ethical business conduct throughout Thomson Reuters, we have instituted a mandatory online training course related to the Code. The Corporate Governance Committee receives an annual report regarding the Code from the General Counsel.
In 2010 and through the date of this annual report, no material violations by our directors or executive officers were reported for the Code of Business Conduct and Ethics. Also, no waivers under the Code were sought by or granted to any of our directors or executive officers.
Additional information regarding the members of our board of directors, including our corporate governance and compensation practices, will be provided in our management proxy circular, which is being prepared in connection with our upcoming annual meeting of shareholders to be held on May 3, 2011. Each board committee has a written charter which is publicly available at www.thomsonreuters.com. The audit committee’s charter has been filed on SEDAR and EDGAR and is incorporated by reference in, and forms a part of, this annual report.
As of March 1, 2011, our executive officers and directors as a group beneficially owned, directly or indirectly, or exercised control or direction over, less than 1% of our outstanding common shares, based on the issued and outstanding shares of our company as of that date. David Thomson and Peter J. Thomson are the Chairmen, and W. Geoffrey Beattie is the President, of Woodbridge, our controlling shareholder. John A. Tory is a director of Woodbridge. As of March 1, 2011, Woodbridge beneficially owned approximately 55% of our common shares.
Thomson Reuters Annual Report 2010
138
ADDITIONAL INFORMATION
Thomson Reuters Corporation was incorporated under the Business Corporations Act (Ontario) by articles of incorporation dated December 28, 1977. Our company amalgamated with one of its wholly owned subsidiaries on March 10, 2010. Our registered office is located at 333 Bay Street, Suite 400, Toronto, Ontario M5H 2R2, Canada. Prior to April 17, 2008, Thomson Reuters Corporation was known as The Thomson Corporation.
DESCRIPTION OF CAPITAL STRUCTURE
As of March 1, 2011:
|
|
—
|
our authorized share capital consisted of an unlimited number of common shares, an unlimited number of preference shares, issuable in series, and a Thomson Reuters Founders Share; and
|
|
|
—
|
we had outstanding 833,933,270 common shares, 6,000,000 Series II preference shares and one Thomson Reuters Founders Share.
|
Common Shares
Each common share entitles its holder to receive notice of, to attend and to vote at all meetings of our shareholders (except for meetings of holders of a particular class or series of shares other than the common shares required by applicable laws to be held as a separate class or series meeting). Each common share also entitles its holder to receive dividends when declared by our board of directors, subject to the rights of holders of the preference shares. All dividends declared by our board of directors are paid equally on all common shares. Holders of common shares will participate equally in any distribution of our assets upon liquidation, dissolution or winding-up, subject to the rights of the holders of the preference shares. There are no preemptive, redemption, purchase or conversion rights attaching to our common shares.
In September 2009, we unified our dual listed company (DLC) structure under which we previously had two parent companies, Thomson Reuters Corporation and Thomson Reuters PLC. In connection with the unification, we began issuing Depositary Interests (DIs) as an alternative way to hold our common shares. DIs are designed to facilitate the transfer and settlement of our shares in the U.K. when they are traded in the secondary market. Each DI represents one common share. The holder of DIs has beneficial ownership of the underlying common shares. Computershare Investor Services PLC, the administrator of our DI program, holds legal title to the common shares and holds the shares on behalf of and for the benefit of the DI holder. Holders of DIs have the same voting rights and receive the same dividends as other common shareholders.
Preference Shares
Our preference shares may be issued in one or more series as determined by our board of directors. Our board of directors is authorized to fix the number, the consideration per share and the rights and restrictions of the preference shares of each series. The preference shares of each series are to rank on a parity with the preference shares of each other series with respect to the payments of dividends and the return of capital on our liquidation, dissolution or winding-up. The preference shares are entitled to preference over the common shares and any other shares ranking junior to the preference shares with respect to the payment of dividends and the return of capital. The special rights and restrictions attaching to the preference shares as a class may not be amended without approval of at least two-thirds of the votes cast at a meeting of the holders of preference shares. The holders of preference shares are not entitled to any voting rights except as provided by our board of directors when authorizing a series or as provided by law. Our Series II preference shares are non-voting and are redeemable at our option for C$25.00 per share, together with accrued dividends. Dividends are payable quarterly at an annual rate of 70% of the Canadian bank prime rate applied to the stated capital of the shares.
Thomson Reuters Founders Share
Our company has issued a Thomson Reuters Founders Share to the Thomson Reuters Founders Share Company, which enables the Founders Share Company to exercise extraordinary voting power to safeguard the Thomson Reuters Trust Principles and to thwart those whose holdings of Thomson Reuters voting shares threaten the Trust Principles. The Founders Share entitles the Founders Share Company to vote in circumstances where an acquiring person, other than an approved person or an entity within Thomson Reuters, has become or becomes “interested” in, or the beneficial owner of, 15% or more of the outstanding voting shares of Thomson Reuters or has obtained or is attempting to obtain the ability to control the exercise of, or beneficial ownership of, 30% or more of the outstanding voting shares of Thomson Reuters. In general, votes cast by the Founders Share Company, alone or in combination with votes cast by approved persons, will be sufficient either to negate the voting power of the acquiring person or to constitute the requisite majority voting power. The rights attaching to the Founders Shares may not be varied or abrogated in any respect without the prior written consent of the Founders Share Company. In addition, without the prior written consent of the Founders Share Company, we may not take certain fundamental corporate actions, including certain changes to our share capital, or remove or amend provisions in our organizational documents relating to the Founders Share Company and the Founders Share. For a discussion of the Thomson Reuters Trust Principles and the Thomson Reuters Founders Share Company, see the “Material Contracts” section of this annual report.
Thomson Reuters Annual Report 2010
139
MARKET FOR SECURITIES
LISTINGS AND INDEX PARTICIPATION
Our common shares are listed in Canadian dollars on the TSX and in U.S. dollars on the NYSE under the symbol “TRI” and our Series II preference shares are listed in Canadian dollars on the TSX under the symbol “TRI.PR.B”. Our company is included in the S&P/TSX series of indices.
SHARE PRICES
The following table provides information regarding the price history of our common shares and Series II preference shares for the periods indicated.
|
Common shares
(C$)
|
Common shares
(US$)
|
Series II preference shares
(C$)
|
||||||||||||||||||||||||||||||||||||||||||||||
|
High
|
Low
|
Closing
|
Trading volume
|
High
|
Low
|
Closing
|
Trading volume
|
High
|
Low
|
Closing
|
Trading volume
|
|||||||||||||||||||||||||||||||||||||
|
2010
|
||||||||||||||||||||||||||||||||||||||||||||||||
|
January
|
35.90 | 33.33 | 35.71 | 21,179,671 | 33.95 | 31.60 | 33.38 | 6,899,305 | 22.35 | 21.25 | 22.34 | 159,466 | ||||||||||||||||||||||||||||||||||||
|
February
|
37.66 | 35.31 | 36.52 | 19,282,896 | 36.07 | 32.96 | 34.73 | 6,193,785 | 23.30 | 21.91 | 23.10 | 282,430 | ||||||||||||||||||||||||||||||||||||
|
March
|
38.14 | 35.83 | 36.96 | 28,267,595 | 37.78 | 34.88 | 36.30 | 4,412,716 | 24.50 | 23.00 | 24.03 | 348,683 | ||||||||||||||||||||||||||||||||||||
|
April
|
37.36 | 35.83 | 36.60 | 20,319,321 | 37.33 | 35.51 | 35.88 | 4,933,168 | 24.24 | 23.25 | 23.41 | 53,857 | ||||||||||||||||||||||||||||||||||||
|
May
|
39.65 | 36.03 | 37.75 | 26,911,450 | 38.91 | 33.27 | 35.31 | 11,472,582 | 23.48 | 21.69 | 22.75 | 47,900 | ||||||||||||||||||||||||||||||||||||
|
June
|
39.95 | 36.56 | 38.10 | 25,593,598 | 39.13 | 34.58 | 35.83 | 45,631,194 | 23.65 | 22.99 | 23.61 | 99,516 | ||||||||||||||||||||||||||||||||||||
|
July
|
40.33 | 37.55 | 38.44 | 18,199,916 | 39.00 | 35.67 | 37.44 | 18,325,445 | 23.65 | 23.25 | 23.50 | 85,986 | ||||||||||||||||||||||||||||||||||||
|
August
|
39.32 | 35.85 | 37.03 | 20,048,491 | 38.39 | 33.68 | 34.80 | 16,614,788 | 23.83 | 23.00 | 23.20 | 80,302 | ||||||||||||||||||||||||||||||||||||
|
September
|
39.30 | 37.30 | 38.68 | 19,366,861 | 38.40 | 35.30 | 37.53 | 13,866,080 | 23.79 | 23.00 | 23.25 | 13,424 | ||||||||||||||||||||||||||||||||||||
|
October
|
40.11 | 38.17 | 38.95 | 13,930,751 | 39.31 | 37.32 | 38.25 | 12,663,866 | 23.26 | 22.25 | 22.50 | 92,920 | ||||||||||||||||||||||||||||||||||||
|
November
|
39.12 | 36.79 | 37.40 | 22,989,831 | 38.78 | 36.05 | 36.36 | 14,274,281 | 22.80 | 22.30 | 22.41 | 69,472 | ||||||||||||||||||||||||||||||||||||
|
December
|
37.94 | 36.63 | 37.24 | 20,222,383 | 37.76 | 36.20 | 37.27 | 12,975,457 | 22.60 | 22.39 | 22.39 | 101,937 | ||||||||||||||||||||||||||||||||||||
|
2011
|
||||||||||||||||||||||||||||||||||||||||||||||||
|
January
|
40.49 | 36.85 | 40.00 | 15,636,709 | 40.48 | 37.11 | 40.01 | 13,430,210 | 23.99 | 22.40 | 23.00 | 53,812 | ||||||||||||||||||||||||||||||||||||
|
February
|
41.61 | 38.16 | 38.32 | 19,213,651 | 42.15 | 38.58 | 39.45 | 16,953,943 | 23.99 | 22.90 | 23.05 | 107,075 | ||||||||||||||||||||||||||||||||||||
In 2010, we issued and sold the following notes:
|
|
—
|
US$500 million 5.85% notes due 2040; and
|
|
|
—
|
C$750 million 4.35% notes due 2020.
|
These notes are not listed or quoted on a marketplace.
DIVIDENDS
Any dividends that we declare on our shares take into account all factors that our board considers relevant, including our available cash flow, financial condition and capital requirements. Our target dividend payout ratio is 40% to 50% of annual free cash flow over the long term.
Our board reviews our dividend policy in the first quarter of each fiscal year. In February 2011, our board approved an increase in our annual dividend to $1.24 per share (or $0.31 per share on a quarterly basis), effective with our dividend payable on March 15, 2011 to holders of record as of February 22, 2011. The declaration of dividends by our board and the amount of those dividends is at the discretion of the board. While we declare dividends in U.S. dollars, shareholders may receive their dividends in other currencies.
Thomson Reuters Annual Report 2010
140
The following table provides information regarding the default currencies for our dividend payments, as well as other currency options that were available to our shareholders as of March 1, 2011.
|
Dividend currency (default)
|
Dividend currency (for electing holders)
|
|
|
Common shares
|
U.S. dollars
|
Canadian dollars
British pounds sterling
|
|
DIs (representing common shares)
|
British pounds sterling
|
U.S. dollars
Canadian dollars
|
|
Series II preference shares
|
Canadian dollars
|
N/A
|
We also have a dividend reinvestment plan which allows eligible holders of our common shares to elect to have their cash dividends reinvested in additional shares.
Additional information regarding currency elections for our dividends as well as our dividend reinvestment plan is provided in the Investor Relations section of our website under “Dividend Information”.
We pay dividends on our Series II preference shares quarterly at an annual rate of 70% of the Canadian bank prime rate applied to the stated capital of these shares.
The table below sets forth the dividends declared on our common shares and Series II preference shares in the last three years and the first quarter of 2011.
|
Common shares (US$)
|
Series II preference shares (C$)
|
|||||||
|
2008
|
||||||||
|
Q1
|
$ | 0.270000 | C$ | 0.250188 | ||||
|
Q2
|
$ | 0.317470 | C$ | 0.212768 | ||||
|
Q3
|
$ | 0.222530 | C$ | 0.208948 | ||||
|
Q4
|
$ | 0.270000 | C$ | 0.180355 | ||||
|
2009
|
||||||||
|
Q1
|
$ | 0.280000 | C$ | 0.131610 | ||||
|
Q2
|
$ | 0.280000 | C$ | 0.101222 | ||||
|
Q3
|
$ | 0.280000 | C$ | 0.099247 | ||||
|
Q4
|
$ | 0.280000 | C$ | 0.099247 | ||||
|
2010
|
||||||||
|
Q1
|
$ | 0.290000 | C$ | 0.097089 | ||||
|
Q2
|
$ | 0.290000 | C$ | 0.100349 | ||||
|
Q3
|
$ | 0.290000 | C$ | 0.119537 | ||||
|
Q4
|
$ | 0.290000 | C$ | 0.132329 | ||||
|
2011
|
||||||||
|
Q1
|
$ | 0.310000 | C$ | * | ||||
|
*
|
The first quarter 2011 dividend on our Series II preference shares had not yet been declared by our company as of the date of this annual report.
|
WOODBRIDGE
As of March 1, 2011, Woodbridge beneficially owned approximately 55% of our common shares and is the principal and controlling shareholder of Thomson Reuters.
Woodbridge, a private company, is the primary investment vehicle for members of the family of the late Roy H. Thomson, the first Lord Thomson of Fleet. Woodbridge is a professionally managed company that, in addition to its controlling interest in Thomson Reuters, has other substantial investments.
Prior to his passing in June 2006, Kenneth R. Thomson controlled our company through Woodbridge. He did so by holding shares of a holding company of Woodbridge, Thomson Investments Limited. Under his estate arrangements, the 2003 TIL Settlement, a trust of which the trust company subsidiary of a Canadian chartered bank is trustee and members of the family of the late first Lord Thomson of Fleet are beneficiaries, holds those holding company shares. Kenneth R. Thomson established these arrangements to provide for long-term stability of the business of Woodbridge. The equity of Woodbridge continues to be owned by members of successive generations of the family of the first Lord Thomson of Fleet.
Thomson Reuters Annual Report 2010
141
Under the estate arrangements of Kenneth R. Thomson, the directors and officers of Woodbridge are responsible for its business and operations. In certain limited circumstances, including very substantial dispositions of Thomson Reuters Corporation common shares by Woodbridge, the estate arrangements provide for approval of the trustee to be obtained. Woodbridge’s primary investment is its holding of our shares. It actively monitors our company as a controlling shareholder. In its involvement with our company, Woodbridge focuses on these matters:
|
|
—
|
corporate governance, including the effectiveness of our board;
|
|
|
—
|
appointment of the Chief Executive Officer and other members of senior management and related succession planning;
|
|
|
—
|
development of the long-term business strategy of Thomson Reuters and assessment of its implementation; and
|
|
|
—
|
capital strategy.
|
With its substantial equity investment in our company, Woodbridge considers that its interests as a Thomson Reuters shareholder are aligned with those of all other shareholders.
The Corporate Governance Committee of our board considers any transactions that may take place between our company and Woodbridge, with any committee members related to Woodbridge abstaining from voting. In addition, any transactions between Woodbridge and our company are subject to public disclosure and other requirements under applicable Canadian securities laws.
TRANSFER AGENTS AND REGISTRARS
|
Type of shares
|
Country
|
Transfer agent/registrar
|
Location of transfer facilities
|
|
Common shares
|
Canada
|
Computershare Trust Company of Canada
|
Toronto, Montreal, Calgary and Vancouver
|
|
United States
|
Computershare Trust Company N.A.
|
Golden, Colorado
|
|
|
United Kingdom
|
Computershare Investor Services PLC
|
Bristol, England
|
|
|
Depositary interests
|
United Kingdom
|
Computershare Investor Services PLC
|
Bristol, England
|
|
Series II preference shares
|
Canada
|
Computershare Trust Company of Canada
|
Toronto
|
RATINGS OF DEBT SECURITIES
Our access to financing depends on, among other things, suitable market conditions and the maintenance of suitable long-term credit ratings. Our credit ratings may be adversely affected by various factors, including increased debt levels, decreased earnings, declines in customer demands, increased competition, a further deterioration in general economic and business conditions and adverse publicity. Any downgrades in our credit ratings may impede our access to the debt markets or raise our borrowing rates.
Our long-term unsecured debt securities are currently rated Baa1 (stable) by Moody’s, A– (stable) by S&P, A (low) (stable) by DBRS and A– (stable) by Fitch. These credit ratings are not recommendations to purchase, hold or sell securities and do not address the market price or suitability of a specific security for a particular investor. Credit ratings may not reflect the potential impact of all risks on the value of securities. In addition, real or anticipated changes in the rating assigned to a security will generally affect the market value of that security. Shareholders cannot be assured that a rating will remain in effect for any given period of time or that a rating will not be revised or withdrawn entirely by a rating agency in the future.
Moody’s Investor Services (Moody’s)
Moody’s long-term credit ratings are on a rating scale that ranges from Aaa to C, which represents the range from highest to lowest quality of such securities rated. Moody’s “Baa” rating assigned to our long-term debt instruments is the fourth highest rating of nine rating categories. Obligations rated “Baa” are subject to moderate credit risk. They are considered medium-grade and as such may possess certain speculative characteristics. Moody’s appends numerical modifiers from 1 to 3 to its long-term debt ratings, which indicate where the obligation ranks in its ranking category, with 1 being the highest.
Thomson Reuters Annual Report 2010
142
Standard & Poor’s (S&P)
S&P’s long-term credit ratings are on a rating scale that ranges from AAA to D, which represents the range from highest to lowest quality of such securities rated. S&P’s “A” rating assigned to our long-term debt instruments is the third highest rating of 10 major rating categories. An “A” rating indicates that the obligor’s capacity to meet its financial commitment is strong, but that the obligation is somewhat more susceptible to adverse effects of changes in circumstances and economic conditions than obligations in higher rated categories. S&P uses “+” or “–” designations to indicate the relative standing of securities within a particular rating category.
DBRS Limited (DBRS)
DBRS’ credit ratings are on a long-term debt rating scale that ranges from AAA to D, which represents the range from highest to lowest quality of such securities rated. DBRS’ “A” rating assigned to our long-term debt is the third highest of the 10 rating categories for long-term debt. Debt securities rated “A” are of satisfactory credit quality and protection of interest and principal is considered substantial. A reference to “high” or “low” reflects the relative strength within the rating category.
Fitch Ratings (Fitch)
Fitch’s long-term credit ratings are on a rating scale that ranges from AAA to D, which represents the range from highest to lowest quality of such securities rated. Fitch’s “A” rating assigned to our long-term debt instruments is the third highest rating of ten rating categories. An “A” rating indicates a low expectation of ceased or interrupted payments and strong capacity to meet obligations on a timely basis. Fitch uses “+” or “-” designations to indicate the relative standing of securities within a particular rating category.
MATERIAL CONTRACTS
CREDIT AGREEMENT
In 2007, we entered into a $2.5 billion unsecured revolving credit facility that currently expires in August 2012. We may request an extension of the maturity date under certain circumstances for up to two additional one-year periods, which the applicable lenders may accept or decline in their sole discretion. We may also request an increase (subject to approval by applicable lenders) in the amount of the lenders’ commitments up to a maximum amount of $3.0 billion. We can utilize the facility to provide liquidity in connection with our commercial paper program and for general corporate purposes. Based on our current credit rating, the cost of borrowing under the agreement is priced at the London Interbank Offered Rate (LIBOR) plus 19 basis points (or plus 24 basis points on all borrowings when line utilization exceeds 50%). If our long-term debt rating was downgraded by Moody’s or S&P, our facility fee and borrowing costs may increase, although availability would be unaffected. Conversely, an upgrade in our ratings may reduce our credit facility fees and borrowing costs.
The credit agreement contains certain customary affirmative and negative covenants, each with customary exceptions. In particular, the credit agreement requires us to maintain a leverage ratio of net debt as of the last day of each fiscal quarter to adjusted EBITDA (earnings before interest, income taxes, depreciation and amortization and other modifications) for the last four fiscal quarters ended of not more than 4.5:1. A change in control of our company would be an event of default under the credit agreement, following which the lenders could decide to terminate the agreement. If a person or group (other than Woodbridge) became the beneficial owner of more than 50% of our voting shares, a change in control would occur.
THOMSON REUTERS TRUST PRINCIPLES AND THOMSON REUTERS FOUNDERS SHARE COMPANY
Our company is dedicated to upholding the Thomson Reuters Trust Principles and to preserving its independence, integrity and freedom from bias in the gathering and dissemination of information and news.
The Trust Principles are:
|
|
—
|
That Thomson Reuters shall at no time pass into the hands of any one interest, group or faction;
|
|
|
—
|
That the integrity, independence and freedom from bias of Thomson Reuters shall at all times be fully preserved;
|
|
|
—
|
That Thomson Reuters shall supply unbiased and reliable news services to newspapers, news agencies, broadcasters and other media subscribers and to businesses, governments, institutions, individuals and others with whom Thomson Reuters has or may have contracts;
|
|
|
—
|
That Thomson Reuters shall pay due regard to the many interests which it serves in addition to those of the media; and
|
|
|
—
|
That no effort shall be spared to expand, develop and adapt the news and other services and products of Thomson Reuters so as to maintain its leading position in the international news and information business.
|
Thomson Reuters Annual Report 2010
143
Thomson Reuters Founders Share Company was established in 1984 when Reuters became a public company. The directors of the Founders Share Company have a duty to ensure, to the extent possible, that the Trust Principles are complied with.
The directors of the Founders Share Company are experienced and eminent people from the world of politics, diplomacy, journalism, public service and business. They generally have all held high offices in their respective sectors. The directors are selected by a nomination committee and proposed to the board of the Founders Share Company for appointment. The nomination committee also has unique features. Two of its members are judges from the European Court of Human Rights and assist in scrutinizing candidates’ suitability. Our board currently has two representatives on the nomination committee and the Founders Share Company’s board has five representatives, including its chairman, who also chairs the committee. Other members are representatives of the press associations from the United Kingdom, Australia and New Zealand.
The directors have a minimum of two meetings per year. Directors receive reports on our activities in the different fields in which we operate and the directors meet with both our board and representatives of senior management. Through the Founders Share Company’s chairman, regular contact is maintained with our company. The relationship is one of trust and confidence.
The current directors, with their countries of residence and the year of initial appointment are:
|
Name
|
Country
|
Director since
|
||
|
Leonard T. Berkowitz
|
U.K.
|
1998
|
||
|
Uffe Ellemann-Jensen
|
Denmark
|
2001
|
||
|
John Fairfax
|
Australia
|
2005
|
||
|
Pehr Gyllenhammar (Chairman)
|
Sweden
|
1997
|
||
|
Pascal Lamy
|
France
|
2009
|
||
|
Joseph Lelyveld
|
U.S.A.
|
2004
|
||
|
Sir Christopher Mallaby (Deputy Chairman)
|
U.K.
|
1998
|
||
| Pedro Malan | Brazil | 2011 | ||
| Mammen Mathew |
India
|
2002
|
||
|
John H. McArthur
|
Canada
|
2001
|
||
|
Dr. Michael Naumann
|
Germany
|
2010
|
||
|
The Right Honourable Baroness Noakes
|
U.K.
|
1998
|
||
|
Jaakko Kaarle M. Rauramo
|
Finland
|
1999
|
The directors are appointed for an initial term of five years and must retire on December 31 following the fifth anniversary following appointment or re-appointment. Directors are eligible for re-appointment for a further term of five years, subject to a maximum term of 15 years.
Our company is a party to an Amended Deed of Mutual Covenant, under which Thomson Reuters and the Founders Share Company have covenanted with United Kingdom, Australian and New Zealand press associations to use their best endeavors to ensure that the Trust Principles are complied with in relation to Thomson Reuters.
Under a Thomson Reuters Trust Principles Support Agreement, Woodbridge has agreed to support the Trust Principles and to exercise its voting rights to give effect to this support and the Founders Share Company has irrevocably designated Woodbridge as an approved person for so long as Woodbridge is controlled by members of the Thomson family, companies controlled by them and trusts for their benefit.
Thomson Reuters Annual Report 2010
144
PRINCIPAL SUBSIDIARIES
The following provides information about our principal subsidiaries as of December 31, 2010. As of that date, we beneficially owned, directly or indirectly, 100% of the voting securities and non-voting securities of each of these subsidiaries. Certain subsidiaries, each of which represents not more than 10% of the consolidated assets and not more than 10% of the consolidated revenues of our company, and all of which, in the aggregate, represent not more than 20% of the total consolidated assets and the total consolidated revenues of our company as of December 31, 2010, have been omitted.
|
Subsidiary
|
Jurisdiction of incorporation/formation
|
|
|
1602854 Ontario Limited
|
Ontario, Canada
|
|
|
3097052 Nova Scotia Company
|
Nova Scotia, Canada
|
|
|
IAG US LLC
|
Delaware, U.S.A.
|
|
|
International Thomson Reuters B.V.
|
The Netherlands
|
|
|
LiveNote Technologies Limited
|
England
|
|
|
LiveNote Inc.
|
Delaware, U.S.A.
|
|
|
LN Holdings Limited
|
Bermuda
|
|
|
Reuters (Canvas) Holdings 1 Limited
|
Bermuda
|
|
|
Reuters Holdings Limited
|
England
|
|
|
Reuters International Holdings SARL
|
Switzerland
|
|
|
Reuters Limited
|
England
|
|
|
Thomcorp Holdings Inc.
|
Delaware, U.S.A.
|
|
|
Thomson Financial Holdings Inc.
|
Delaware, U.S.A.
|
|
|
Thomson PME LLC
|
Delaware, U.S.A.
|
|
|
Thomson Reuters (Legal) Inc.
|
Minnesota, U.S.A.
|
|
|
Thomson Reuters (Markets) LLC
|
Delaware, U.S.A.
|
|
|
Thomson Reuters (Markets) SA
|
Switzerland
|
|
|
Thomson Reuters (Tax & Accounting) Inc.
|
Texas, U.S.A.
|
|
|
Thomson Reuters (TRI) Inc.
|
Delaware, U.S.A.
|
|
|
Thomson Reuters Canada Limited
|
Ontario, Canada
|
|
|
Thomson Reuters Finance S.A.
|
Luxembourg
|
|
|
Thomson Reuters Global Resources
|
Ireland
|
|
|
Thomson Reuters Group Limited
|
England
|
|
|
Thomson Reuters Holdings A.G.
|
Switzerland
|
|
|
Thomson Reuters Holdings B.V.
|
The Netherlands
|
|
|
Thomson Reuters Holdings S.A.
|
Luxembourg
|
|
|
Thomson Reuters Investment Holdings Limited
|
England
|
|
|
Thomson Reuters Netherlands Holdings BV
|
The Netherlands
|
|
|
Thomson Reuters No. 4 Inc.
|
Delaware, U.S.A.
|
|
|
Thomson Reuters No. 5 LLC
|
Delaware, U.S.A.
|
|
|
Thomson Reuters No. 8 Inc.
|
Delaware, U.S.A.
|
|
|
Thomson Reuters Organization Corp.
|
Florida, U.S.A.
|
|
|
Thomson Reuters U.S. Holdings Inc.
|
Delaware, U.S.A.
|
|
|
Thomson Reuters U.S. Inc.
|
Delaware, U.S.A.
|
|
|
Thomson Reuters U.S.A. Inc.
|
Delaware, U.S.A.
|
|
|
Thomson TradeWeb LLC
|
Delaware, U.S.A.
|
|
|
TR (2008) Limited
|
England
|
|
|
TR Holdings Limited
|
Bermuda
|
|
|
TR International Holdings S.à.r.l.
|
Luxembourg
|
|
|
TR Netherlands Holdings Coöperatief U.A.
|
The Netherlands
|
|
|
TR U.S. Inc.
|
Delaware, U.S.A.
|
|
|
West Publishing Corporation
|
Minnesota, U.S.A.
|
|
|
West Services Inc.
|
Delaware, U.S.A.
|
Thomson Reuters Annual Report 2010
145
INTEREST OF EXPERTS
Our independent auditors are PricewaterhouseCoopers LLP, Chartered Accountants, who have issued an integrated auditors’ report dated March 9, 2011 in respect of our consolidated financial statements for the years ended December 31, 2010 and December 31, 2009, and on our effectiveness of internal control over financial reporting as of December 31, 2010. PricewaterhouseCoopers LLP has advised that they are independent with respect to our company within the meaning of the Rules of Professional Conduct of the Institute of Chartered Accountants of Ontario, and the rules of the U.S. Securities and Exchange Commission and the requirements of the Public Company Accounting Oversight Board (United States).
Additional information on our auditors will be included in our management proxy circular being prepared in connection with our upcoming annual meeting of shareholders to be held on May 3, 2011.
FURTHER INFORMATION
For more information about Thomson Reuters, please see our various filings and notifications posted on our website, www.thomsonreuters.com, the Canadian Securities Administrators’ SEDAR website, www.sedar.com, and in the EDGAR section of the Securities and Exchange Commission’s (SEC) website at www.sec.gov. In addition, you may review a copy of our filings with at the SEC’s Public Reference Room at 100 F Street, N.E., Room 1580, Washington, D.C. 20549. Please call the SEC at 1-800-SEC-0330 for further information.
Additional information, including directors’ and officers’ remuneration and indebtedness, principal holders of our shares, securities authorized for issuance under our equity compensation plans, will be contained in our management proxy circular, which is being prepared in connection with our upcoming annual meeting of shareholders to be held on May 3, 2011. Copies of our management proxy circular will be available upon request in writing to: Investor Relations Department, Thomson Reuters, 3 Times Square, New York, NY 10036, United States. Requests may also be sent by e-mail to: investor.relations@thomsonreuters.com.
Information required to be provided pursuant to Canadian Securities Administrators Multilateral Instrument Form 52-110F1 (Audit Committees) for our company is included in the "Executive Officers and Directors" section of this annual report.
Under NYSE listing standards, we are required to disclose any significant ways in which our corporate governance practices differ from those required to be followed by U.S. domestic companies under NYSE listing standards. There is only one significant difference between our corporate governance practices and those required of domestic companies under NYSE listing standards. NYSE listing standards require shareholder approval of all “equity compensation plans” and material revisions to these types of plans (with limited exceptions). TSX rules require shareholder approval of security based compensation arrangements only for plans which involve newly issued shares or specified amendments to the plans. Similar to a number of other Canadian issuers, our company follows the TSX rules.
Our Code of Business Conduct and Ethics, corporate governance guidelines and board committee charters are available on www.thomsonreuters.com as well as in print or electronically (without charge) to any shareholder who requests a copy in writing or by e-mail to our Investor Relations Department. Shareholders and other interested parties may contact the board or its non-management or independent directors as a group, or the directors who preside over their meetings, by writing to them c/o Secretary to the Board, 65 Queen Street West, Suite 2400, Toronto, Ontario M5H 2M8, Canada.
Any statement in this annual report about any of our contracts or other documents is not necessarily complete. If the contract or document is filed as an exhibit to our annual report with the SEC or as a material contract with the Canadian securities regulatory authorities, then the contract or document is deemed to modify the description contained in this annual report. You should review the contracts or documents themselves for a complete description.
We are required to file reports and other information with the SEC under the U.S. Securities Exchange Act and regulations under that act. As a foreign private issuer, we are exempt from the rules under the U.S. Securities Exchange Act prescribing the form and content of proxy statements and our officers, directors and principal shareholders are exempt from the reporting and short swing profit recovery provisions contained in Section 16 of the U.S. Securities Exchange Act.
Front cover photo credit: REUTERS/Christian Charisius, July 19, 2009.
Thomson Reuters Annual Report 2010
146
CROSS REFERENCE TABLES
For the convenience of our shareholders, we have prepared one annual report for the year ended December 31, 2010 that addresses our disclosure requirements under applicable Canadian and U.S. laws and regulations.
The following pages include cross reference tables that reflect where we have disclosed information required to be contained in an annual information form prepared in accordance with Canadian laws and regulations and an annual report on Form 40-F prepared in accordance with SEC requirements.
ANNUAL INFORMATION FORM (FORM 51-102F2) CROSS REFERENCE TABLE
|
Page/Document
|
||
|
ITEM 1. COVER PAGE
|
Cover
|
|
|
ITEM 2. TABLE OF CONTENTS
|
1
|
|
|
ITEM 3. CORPORATE STRUCTURE
|
||
|
3.1 Name, Address and Incorporation
|
139
|
|
|
3.2 Intercorporate Relationships
|
145
|
|
|
ITEM 4. GENERAL DEVELOPMENT OF THE BUSINESS
|
||
|
4.1 Three Year History
|
33-39
|
|
|
4.2 Significant Acquisitions
|
16-17, 26-27
|
|
|
ITEM 5. DESCRIBE THE BUSINESS
|
||
|
5.1 General
|
2-17
|
|
|
5.2 Risk Factors
|
18-22
|
|
|
5.3 Companies with Asset-backed Securities Outstanding
|
N/A
|
|
|
5.4 Companies With Mineral Projects
|
N/A
|
|
|
5.5 Companies with Oil and Gas Activities
|
N/A
|
|
|
ITEM 6. DIVIDENDS
|
140-141
|
|
|
ITEM 7. DESCRIPTION OF CAPITAL STRUCTURE
|
||
|
7.1 General Description of Capital Structure
|
139
|
|
|
7.2 Constraints
|
N/A
|
|
|
7.3 Ratings
|
142-143
|
|
|
ITEM 8. MARKET FOR SECURITIES
|
||
|
8.1 Trading Price and Volume
|
140
|
|
|
8.2 Prior Sales
|
140
|
|
|
ITEM 9. ESCROWED SECURITIES AND SECURITIES SUBJECT TO CONTRACTUAL RESTRICTION ON TRANSFER
|
N/A
|
|
|
ITEM 10. DIRECTORS AND OFFICERS
|
||
|
10.1 Name, Occupation and Security Holding
|
133-138
|
|
|
10.2 Cease Trade Orders, Bankruptcies, Penalties or Sanctions
|
N/A
|
|
|
10.3 Conflicts of Interest
|
N/A
|
|
|
ITEM 11. PROMOTERS
|
N/A
|
|
|
ITEM 12. LEGAL PROCEEDINGS AND REGULATORY ACTIONS
|
||
|
12.1 Legal Proceedings
|
53
|
|
|
12.2 Regulatory Actions
|
53
|
|
|
ITEM 13. INTEREST OF MANAGEMENT AND OTHERS IN MATERIAL TRANSACTIONS
|
56-57
|
|
|
ITEM 14. TRANSFER AGENTS AND REGISTRARS
|
142
|
|
|
ITEM 15. MATERIAL CONTRACTS
|
143
|
|
|
ITEM 16. INTEREST OF EXPERTS
|
||
|
16.1 Names of Experts
|
146
|
|
|
16.2 Interests of Experts
|
146
|
|
|
ITEM 17. ADDITIONAL INFORMATION
|
146
|
|
|
ITEM 18. ADDITIONAL DISCLOSURE FOR COMPANIES NOT SENDING INFORMATION CIRCULARS
|
N/A
|
|
Thomson Reuters Annual Report 2010
147
FORM 40-F CROSS REFERENCE TABLE
|
Page/Document
|
||
|
ANNUAL INFORMATION FORM
|
See AIF table
|
|
|
AUDITED ANNUAL FINANCIAL STATEMENTS
|
74-132
|
|
|
MANAGEMENT'S DISCUSSION AND ANALYSIS
|
23-73
|
|
|
DISCLOSURE CONTROLS AND PROCEDURES
|
59
|
|
|
INTERNAL CONTROL OVER FINANCIAL REPORTING
|
||
|
a. Changes in Internal Controls over Financial Reporting
|
59
|
|
|
b. Management's Report on Internal Control over Financial Reporting
|
74
|
|
|
c. Independent Auditor's Report on Internal Control over Financial Reporting
|
75-76
|
|
|
NOTICE PURSUANT TO REGULATION BTR
|
N/A
|
|
|
AUDIT COMMITTEE FINANCIAL EXPERT
|
136
|
|
|
CODE OF ETHICS
|
138
|
|
|
PRINCIPAL ACCOUNTANT FEES AND SERVICES
|
136-137
|
|
|
OFF-BALANCE SHEET ARRANGEMENTS
|
51-52
|
|
|
TABULAR DISCLOSURE OF CONTRACTUAL OBLIGATIONS
|
51-52
|
|
|
IDENTIFICATION OF THE AUDIT COMMITTEE
|
134-136
|
|
148
Exhibit 99.2
Consent of Independent Auditors
We hereby consent to the incorporation by reference in this Annual Report on Form 40-F for the year ended December 31, 2010 of Thomson Reuters Corporation of our report dated March 9, 2011 relating to the consolidated financial statements and the effectiveness of internal control over financial reporting, which appears in Exhibit 99.1 incorporated by reference in this Annual Report.
We also consent to the incorporation by reference in the Registration Statements on Form S-8 (No. 333-12284), Form S-8 (No. 333-126782), Form S-8 (No. 333-135721), Form S-8 (No. 333-152029), Form S-8 (333-162035) and Form F-3 (No. 333-150560) of our report referred to above.
We also consent to the reference to us under the heading "Interest of Experts" in the Annual Report which appears in this Annual Report on Form 40-F, which is incorporated by reference in such Registration Statements.
Chartered Accountants, Licensed Public Accountants
Toronto, Canada
March 9, 2011
Exhibit 99.3
CERTIFICATION OF THE CHIEF EXECUTIVE OFFICER
PURSUANT TO SECTION 302 OF THE SARBANES-OXLEY ACT OF 2002
I, Thomas H. Glocer, certify that:
|
1.
|
I have reviewed this annual report on Form 40-F of Thomson Reuters Corporation;
|
|
2.
|
Based on my knowledge, this report does not contain any untrue statement of a material fact or omit to state a material fact necessary to make the statements made, in light of the circumstances under which such statements were made, not misleading with respect to the period covered by this report;
|
|
3.
|
Based on my knowledge, the financial statements, and other financial information included in this report, fairly present in all material respects the financial condition, results of operations and cash flows of the issuer as of, and for, the periods presented in this report;
|
|
4.
|
The issuer’s other certifying officer(s) and I are responsible for establishing and maintaining disclosure controls and procedures (as defined in Exchange Act Rules 13a-15(e) and 15d-15(e)) and internal control over financial reporting (as defined in Exchange Act Rules 13a-15(f) and 15d-15(f)) for the issuer and have:
|
|
|
a)
|
Designed such disclosure controls and procedures, or caused such disclosure controls and procedures to be designed under our supervision, to ensure that material information relating to the issuer, including its consolidated subsidiaries, is made known to us by others within those entities, particularly during the period in which this report is being prepared;
|
|
|
b)
|
Designed such internal control over financial reporting, or caused such internal control over financial reporting to be designed under our supervision, to provide reasonable assurance regarding the reliability of financial reporting and the preparation of financial statements for external purposes in accordance with generally accepted accounting principles;
|
|
|
c)
|
Evaluated the effectiveness of the issuer’s disclosure controls and procedures and presented in this report our conclusions about the effectiveness of the disclosure controls and procedures, as of the end of the period covered by this report based on such evaluation; and
|
|
|
d)
|
Disclosed in this report any change in the issuer’s internal control over financial reporting that occurred during the period covered by the annual report that has materially affected, or is reasonably likely to materially affect, the issuer’s internal control over financial reporting; and
|
|
5.
|
The issuer’s other certifying officer(s) and I have disclosed, based on our most recent evaluation of internal control over financial reporting, to the issuer’s auditors and the audit committee of the issuer’s board of directors (or persons performing the equivalent functions):
|
|
|
a)
|
All significant deficiencies and material weaknesses in the design or operation of internal control over financial reporting which are reasonably likely to adversely affect the issuer’s ability to record, process, summarize and report financial information; and
|
|
|
b)
|
Any fraud, whether or not material, that involves management or other employees who have a significant role in the issuer’s internal control over financial reporting.
|
|
Date: March 9, 2011
|
||
|
/s/ Thomas H. Glocer
|
||
|
Thomas H. Glocer
|
||
|
Chief Executive Officer
|
Exhibit 99.4
CERTIFICATION OF THE CHIEF FINANCIAL OFFICER
PURSUANT TO SECTION 302 OF THE SARBANES-OXLEY ACT OF 2002
I, Robert D. Daleo, certify that:
|
1.
|
I have reviewed this annual report on Form 40-F of Thomson Reuters Corporation;
|
|
2.
|
Based on my knowledge, this report does not contain any untrue statement of a material fact or omit to state a material fact necessary to make the statements made, in light of the circumstances under which such statements were made, not misleading with respect to the period covered by this report;
|
|
3.
|
Based on my knowledge, the financial statements, and other financial information included in this report, fairly present in all material respects the financial condition, results of operations and cash flows of the issuer as of, and for, the periods presented in this report;
|
|
4.
|
The issuer’s other certifying officer(s) and I are responsible for establishing and maintaining disclosure controls and procedures (as defined in Exchange Act Rules 13a-15(e) and 15d-15(e)) and internal control over financial reporting (as defined in Exchange Act Rules 13a-15(f) and 15d-15(f)) for the issuer and have:
|
|
|
a)
|
Designed such disclosure controls and procedures, or caused such disclosure controls and procedures to be designed under our supervision, to ensure that material information relating to the issuer, including its consolidated subsidiaries, is made known to us by others within those entities, particularly during the period in which this report is being prepared;
|
|
|
b)
|
Designed such internal control over financial reporting, or caused such internal control over financial reporting to be designed under our supervision, to provide reasonable assurance regarding the reliability of financial reporting and the preparation of financial statements for external purposes in accordance with generally accepted accounting principles;
|
|
|
c)
|
Evaluated the effectiveness of the issuer’s disclosure controls and procedures and presented in this report our conclusions about the effectiveness of the disclosure controls and procedures, as of the end of the period covered by this report based on such evaluation; and
|
|
|
d)
|
Disclosed in this report any change in the issuer’s internal control over financial reporting that occurred during the period covered by the annual report that has materially affected, or is reasonably likely to materially affect, the issuer’s internal control over financial reporting; and
|
|
5.
|
The issuer’s other certifying officer(s) and I have disclosed, based on our most recent evaluation of internal control over financial reporting, to the issuer’s auditors and the audit committee of the issuer’s board of directors (or persons performing the equivalent functions):
|
|
|
a)
|
All significant deficiencies and material weaknesses in the design or operation of internal control over financial reporting which are reasonably likely to adversely affect the issuer’s ability to record, process, summarize and report financial information; and
|
|
|
b)
|
Any fraud, whether or not material, that involves management or other employees who have a significant role in the issuer’s internal control over financial reporting.
|
|
Date: March 9, 2011
|
||
|
/s/ Robert D. Daleo
|
||
|
Robert D. Daleo
|
||
|
Executive Vice President and Chief Financial Officer
|
Exhibit 99.5
CERTIFICATION OF THE CHIEF EXECUTIVE OFFICER
PURSUANT TO 18 U.S.C. SECTION 1350 AS ADOPTED BY
SECTION 906 OF THE SARBANES-OXLEY ACT OF 2002
I, Thomas H. Glocer, Chief Executive Officer of Thomson Reuters Corporation (the “Company”), hereby certify, pursuant to 18 U.S.C. Section 1350, as adopted pursuant to Section 906 of the Sarbanes-Oxley Act of 2002, that:
a) The Company’s Annual Report on Form 40-F for the year ended December 31, 2010 (the “Form 40-F”) fully complies with the requirements of Section 13(a) or 15(d) of the Securities Exchange Act of 1934, as amended; and
b) The information contained in the Form 40-F fairly presents, in all material respects, the financial condition and results of operations of the Company.
|
Date:
|
March 9, 2011
|
|
|
By:
|
/s/ Thomas H. Glocer
|
|
|
Thomas H. Glocer
|
||
|
Chief Executive Officer
|
A signed original of this written statement has been provided to Thomson Reuters Corporation and will be retained by Thomson Reuters Corporation and furnished to the Securities and Exchange Commission or its staff upon request.
Exhibit 99.6
CERTIFICATION OF THE CHIEF FINANCIAL OFFICER
PURSUANT TO 18 U.S.C. SECTION 1350 AS ADOPTED BY
SECTION 906 OF THE SARBANES-OXLEY ACT OF 2002
I, Robert D. Daleo, Executive Vice President and Chief Financial Officer of Thomson Reuters Corporation (the “Company”), hereby certify, pursuant to 18 U.S.C. Section 1350, as adopted pursuant to Section 906 of the Sarbanes-Oxley Act of 2002, that:
a) The Company’s Annual Report on Form 40-F for the year ended December 31, 2010 (the “Form 40-F”) fully complies with the requirements of Section 13(a) or 15(d) of the Securities Exchange Act of 1934, as amended; and
b) The information contained in the Form 40-F fairly presents, in all material respects, the financial condition and results of operations of the Company.
|
Date:
|
March 9, 2011
|
|
|
By:
|
/s/ Robert D. Daleo
|
|
|
Robert D. Daleo
|
||
|
Executive Vice President and Chief Financial Officer
|
A signed original of this written statement has been provided to Thomson Reuters Corporation and will be retained by Thomson Reuters Corporation and furnished to the Securities and Exchange Commission or its staff upon request.
Exhibit 99.7
THOMSON REUTERS
AUDIT COMMITTEE CHARTER
Adopted effective
March 1, 2011
TABLE OF CONTENTS
|
1.
|
PURPOSE
|
1
|
|
2.
|
MEMBERS
|
1
|
|
3.
|
RESPONSIBILITIES
|
1
|
|
4.
|
COMPLAINTS PROCEDURE
|
7
|
|
5.
|
REPORTING
|
7
|
|
6.
|
REVIEW AND DISCLOSURE
|
7
|
|
7.
|
ASSESSMENT
|
7
|
|
8.
|
MEETINGS
|
8
|
|
9.
|
CHAIR
|
8
|
|
10.
|
REMOVAL AND VACANCIES
|
8
|
|
11.
|
ACCESS TO MANAGEMENT AND OUTSIDE ADVISORS
|
8
|
|
12.
|
DEFINITIONS
|
8
|
i
THOMSON REUTERS
AUDIT COMMITTEE CHARTER
|
1.
|
PURPOSE
|
The Audit Committee is responsible for assisting the Board of Directors (the “Board”) of Thomson Reuters Corporation (the “Corporation”) in fulfilling its oversight responsibilities in relation to:
|
|
·
|
the integrity of financial statements and other financial information relating to the Corporation and its subsidiaries (collectively, “Thomson Reuters”);
|
|
|
·
|
Thomson Reuters compliance with risk management, and legal and regulatory requirements;
|
|
|
·
|
the qualifications, independence and performance of Thomson Reuters auditor;
|
|
|
·
|
the adequacy and effectiveness of Thomson Reuters internal control over financial reporting and disclosure controls and procedures;
|
|
|
·
|
the effectiveness of Thomson Reuters internal audit function; and
|
|
|
·
|
any additional matters delegated to the Audit Committee by the Board.
|
|
2.
|
MEMBERS
|
The Board must appoint a minimum of three and a maximum of five directors to be members of the Audit Committee. The members of the Audit Committee are selected by the Board on the recommendation of the Corporate Governance Committee. All members of the Audit Committee must meet the criteria for independence contained in applicable law and stock exchange rules and requirements.
Every member of the Audit Committee must be Financially Literate. In addition, the Board will determine and publicly disclose whether at least one member has accounting or related financial management expertise as defined in applicable NYSE rules, including whether that member is an Audit Committee Financial Expert.
Members of the Audit Committee may not serve on more than two other public company audit committees except with the prior approval of the Board.
|
3.
|
RESPONSIBILITIES
|
The Audit Committee is responsible for performing the duties set out below as well as any other duties that are otherwise required by applicable law or stock exchange rules and requirements or are delegated to the Audit Committee by the Board.
|
|
(a)
|
Appointment and Review of the Auditor
|
The auditor is accountable to the Audit Committee and reports directly to the Audit Committee. Accordingly, the Audit Committee will evaluate and be responsible for Thomson Reuters relationship with the auditor. Specifically, the Audit Committee will:
|
|
·
|
select, evaluate and nominate the auditor to be proposed for appointment or reappointment, as the case may be, by the shareholders;
|
|
|
·
|
review and approve the auditor’s engagement letter;
|
|
|
·
|
after seeking and taking into account the views of senior management and the officer in charge of internal audit, review the independence, experience, qualifications and performance of the auditor, including the lead audit partner;
|
|
|
·
|
oversee the auditor’s work, including investigating and resolving any disagreements between senior management and the auditor regarding financial reporting or the internal audit function;
|
|
|
·
|
at least annually, obtain and review a report by the auditor describing its internal quality-control procedures, any material issues raised by the most recent internal quality-control review, or peer review, of the firm, or by any inquiry or investigation by governmental or professional authorities, within the preceding five years, respecting one or more independent audits carried out by the auditor and any steps taken to deal with any such issues; and
|
|
|
·
|
where appropriate, terminate the auditor.
|
|
|
(b)
|
Confirmation of the Auditor’s Independence
|
At least annually, and before the auditor issues its report on the Corporation’s annual consolidated financial statements, the Audit Committee will:
|
|
·
|
confirm that the auditor has submitted a formal written statement describing all of its relationships with Thomson Reuters that in the auditor’s professional judgment may reasonably be thought to bear on its independence;
|
|
|
·
|
discuss with the auditor any disclosed relationships or services, including any non-audit services the auditor has provided, that may affect its independence;
|
|
|
·
|
obtain written confirmation from the auditor that it is independent with respect to Thomson Reuters within the meaning of the Rules of Professional Conduct adopted by the Ontario Institute of Chartered Accountants to which it belongs and that it is an independent public accountant with respect to Thomson Reuters within the meaning of the federal securities legislation administered by the United States Securities and Exchange Commission; and
|
|
|
·
|
confirm that the auditor has complied with applicable law with respect to the rotation of certain members of the audit engagement team for Thomson Reuters.
|
- 2 -
|
|
(c)
|
Pre-Approval of Non-Audit Services
|
The Audit Committee will pre-approve the appointment of the auditor for any non-audit services, provided that it will not approve any services that are prohibited under applicable law. The Audit Committee has established policies and procedures, and may revise such from time to time, which pre-approve the appointment of the auditor for certain non-audit services. In addition, the Audit Committee may delegate to one or more independent members the authority to pre-approve the appointment of the auditor for any non-audit services to the extent permitted by applicable law, provided that any pre-approvals granted pursuant to such delegation shall be reported to the full Audit Committee at its next scheduled meeting following such pre-approval.
|
|
(d)
|
Communications with the Auditor
|
The Audit Committee has the authority to communicate directly with the auditor and will meet privately with the auditor as frequently as the Audit Committee determines is appropriate to fulfill its responsibilities, which will not be less frequently than annually, to discuss any items of concern to the Audit Committee or the auditor, including, without limitation:
|
|
·
|
planning and staffing of the audit;
|
|
|
·
|
any material written communications between the auditor and senior management, such as any management letter or schedule of unadjusted differences;
|
|
|
·
|
whether or not the auditor is satisfied with the quality and effectiveness of financial recording procedures and systems;
|
|
|
·
|
the extent to which the auditor is satisfied with the nature and scope of its examination;
|
|
|
·
|
any instances of fraud or other illegal acts involving senior management or employees involved in financial reporting of Thomson Reuters;
|
|
|
·
|
whether or not the auditor has received the full cooperation of senior management and other employees of Thomson Reuters and whether the auditor has encountered any audit problems or difficulties in the course of its audit work, including any restrictions on the scope of the auditor’s work or access to required information and any significant disagreements with management (along with management’s response);
|
|
|
·
|
the auditor’s opinion of the competence and performance of the Chief Financial Officer and other key financial personnel; and
|
|
|
·
|
the items required to be communicated to the Audit Committee under the Canadian authoritative guidance or under Canadian generally accepted auditing standards (“GAAS”).
|
- 3 -
|
|
(e)
|
Review of the Audit Plan
|
The Audit Committee will discuss with the auditor the nature of an audit and the responsibility assumed by the auditor when conducting an audit of financial statements prepared in accordance with International Financial Reporting Standards as issued by the International Accounting Standards Board (“IFRS”). The Audit Committee will review a summary of the auditor’s audit plan for each audit.
|
|
(f)
|
Review of Audit Fees
|
The Audit Committee will determine the auditor’s fee and other terms of the auditor’s engagement. In determining the auditor’s fee, the Audit Committee will consider, among other things, the number and nature of reports to be issued by the auditor, the quality of the internal control over financial reporting of Thomson Reuters, the size, complexity and financial condition of Thomson Reuters and the extent of internal audit and other support to be provided to the auditor by Thomson Reuters.
|
|
(g)
|
Review of Financial Statements
|
The Audit Committee will review and discuss the following with senior management and the auditor, before recommending them for approval by the Board:
|
|
·
|
the annual and quarterly consolidated financial statements of the Corporation and the related management’s discussion and analysis;
|
|
|
·
|
all critical accounting policies and practices used or to be used by Thomson Reuters; and
|
|
|
·
|
all alternative treatments of financial information within IFRS that have been discussed with senior management, ramifications of the use of such alternative disclosures and treatments, and the treatment preferred by the auditor.
|
The Audit Committee will also engage the auditor to review the quarterly consolidated financial statements of the Corporation and any reconciliation of such financial statements prior to the Audit Committee’s review of such financial statements or reconciliation.
|
|
(h)
|
Review of Other Financial Information
|
The Audit Committee will:
|
|
·
|
review annual and quarterly earnings press releases prior to their public release, as well as any financial information and earnings guidance provided to analysts and rating agencies. The Audit Committee will also review the type and presentation of information to be included in such press releases and guidance (including the use of “pro forma” or “adjusted” non-IFRS financial measures). The Audit Committee’s review in this regard may be general in nature (i.e., a discussion of the types of information to be disclosed and the type of presentation to be made) and need not take place in advance of each instance in which Thomson Reuters may provide financial information or earnings guidance;
|
- 4 -
|
|
·
|
periodically assess the adequacy of procedures that are in place for management’s review of all other financial information extracted or derived from Thomson Reuters financial statements that were previously reviewed by the Audit Committee before such information is released to the public, including, without limitation, financial information or statements for use in prospectuses or other offering or public disclosure documents and financial statements required by regulatory authorities;
|
|
|
·
|
review major issues regarding accounting principles and financial statement presentations, including any significant changes in Thomson Reuters selection or application of accounting principles, and major issues as to the adequacy of Thomson Reuters internal control over financial reporting and any special audit steps adopted in light of any material control deficiencies;
|
|
|
·
|
review analyses prepared by management and/or the auditor setting forth significant financial reporting issues and judgments made in connection with the preparation of Thomson Reuters financial statements, including analyses of the effects of alternative IFRS methods on the financial statements; and
|
|
|
·
|
review the effect of regulatory and accounting initiatives as well as off-balance sheet structures on the financial statements.
|
|
|
(i)
|
Review of the Internal Audit Function
|
The Audit Committee will review the mandate, budget, planned activities, staffing and organizational structure of Thomson Reuters internal audit function (part of which may be outsourced to a firm other than the auditor) to confirm that it is independent of management and has sufficient resources to carry out its mandate. The Audit Committee will discuss this mandate with the auditor.
The Audit Committee will review the appointment and replacement of the officer in charge of internal audit and will review the significant reports to management prepared by the internal audit department and management’s responses. The Audit Committee will also annually review the effectiveness of the internal audit function and will report its findings to the Board.
The Audit Committee has the authority to communicate directly with the officer in charge of internal audit and will meet privately with the officer in charge of internal audit as frequently as the Audit Committee determines is appropriate to fulfill its responsibilities, which will not be less frequently than annually, to discuss any areas of concern to the Audit Committee or the officer in charge of internal audit.
- 5 -
|
|
(j)
|
Relations with Senior Management
|
The Audit Committee members will meet privately with senior management as frequently as the Audit Committee determines is appropriate to fulfill its responsibilities, which will not be less frequently than annually, to discuss any areas of concern to the Audit Committee or senior management.
|
|
(k)
|
Oversight of Internal Controls and Disclosure Controls
|
The Audit Committee will review with senior management the adequacy and effectiveness of internal control over financial reporting (within the meaning of applicable law) that is maintained by Thomson Reuters to provide reasonable assurance regarding the reliability of financial reporting and the preparation of financial statements in accordance with IFRS. The Audit Committee will review any special audit steps adopted in light of material weaknesses or significant deficiencies (in each case within the meaning of applicable law).
The Audit Committee will review with senior management the disclosure controls and procedures (within the meaning of applicable law) that are maintained by Thomson Reuters to confirm that material information about Thomson Reuters that is required to be disclosed under applicable law or stock exchange rules and requirements is disclosed within the required time periods.
The Audit Committee will also review disclosures made to it by the Chief Executive Officer and Chief Financial Officer during their certification process for applicable securities law filings about any material weaknesses or significant deficiencies in the design or operation of Thomson Reuters internal control over financial reporting and any fraud, whether or not material, involving management or other employees who have a significant role in Thomson Reuters internal control over financial reporting.
|
|
(l)
|
Legal and Regulatory Compliance
|
The Audit Committee will review with Thomson Reuters legal counsel:
|
|
·
|
any material legal or regulatory matters; and
|
|
|
·
|
any material inquiries received from regulators and governmental agencies.
|
|
(m)
|
Risk Assessment and Risk Management
|
The Audit Committee will review periodically with senior management controls and policies of Thomson Reuters with respect to risk assessment and risk management, including the steps and process taken to monitor and control risks.
- 6 -
|
|
(n)
|
Taxation Matters
|
The Audit Committee will periodically review with senior management the status of significant taxation matters of Thomson Reuters.
|
|
(o)
|
Hiring Employees of the Auditor
|
The Audit Committee will maintain and monitor compliance with policies for hiring partners and employees and former partners and employees of the auditor.
|
4.
|
COMPLAINTS PROCEDURE
|
The Audit Committee will maintain procedures for the receipt, retention and treatment of complaints received by Thomson Reuters regarding accounting, internal accounting controls, auditing matters and disclosure controls and procedures for the confidential, anonymous submission of concerns by employees of Thomson Reuters regarding questionable accounting, internal accounting controls, auditing matters or disclosure controls and procedures.
|
5.
|
REPORTING
|
The Audit Committee will:
|
|
·
|
regularly report to the Board on all significant matters it has addressed and with respect to such other matters as are within its responsibilities; and
|
|
|
·
|
oversee the preparation of and review any disclosure with respect to its activities in discharging the responsibilities set out in this Charter included in materials sent to shareholders of the Corporation.
|
|
6.
|
REVIEW AND DISCLOSURE
|
The Audit Committee will review this Charter at least annually and submit it to the Corporate Governance Committee together with any proposed amendments. The Corporate Governance Committee will review this Charter and submit it to the Board for approval with such further amendments as it deems necessary and appropriate.
|
7.
|
ASSESSMENT
|
At least annually, the Board, acting through the Corporate Governance Committee, will review the effectiveness of the Audit Committee in fulfilling its responsibilities and duties as set out in this Charter and in a manner consistent with the Corporate Governance Guidelines adopted by the Board.
- 7 -
|
8.
|
MEETINGS
|
Quorum for meetings of the Audit Committee will be a majority of its members. A meeting of the Audit Committee may be called by the Chair or any other member of the Audit Committee, the Chairman, a Deputy Chairman, the Chief Executive Officer, the auditor, the officer in charge of the internal audit or the Secretary to the Audit Committee. The Secretary to the Board will act as Secretary to the Audit Committee unless the Chair of the Audit Committee decides otherwise.
The Audit Committee will ordinarily meet in camera at the end of each of its meetings and may meet in camera at any other time as required.
|
9.
|
CHAIR
|
Each year, the Board on the recommendation of the Corporate Governance Committee will appoint one member to be Chair of the Audit Committee. If, in any year, the Board does not appoint a Chair, the incumbent Chair will continue in office until a successor is appointed.
|
10.
|
REMOVAL AND VACANCIES
|
Any member may be removed and replaced at any time by the Board, and will automatically cease to be a member as soon as the member ceases to meet the qualifications set out above. The Board will fill vacancies on the Audit Committee by appointment from among qualified members of the Board. If a vacancy exists on the Audit Committee, the remaining members will exercise all of its powers so long as a quorum remains in office.
|
11.
|
ACCESS TO MANAGEMENT AND OUTSIDE ADVISORS
|
The Audit Committee may invite any member of management, employee, outside advisor or other person to attend any of its meetings.
In carrying out its duties, the Audit Committee may retain an outside advisor without Board approval at the expense of Thomson Reuters and has the authority to determine any such advisor’s fees and other retention terms. Thomson Reuters will also provide appropriate funding, as determined by the Audit Committee, for the payment of the compensation of the auditor, independent counsel and outside advisors and any ordinary administrative expenses of the Audit Committee that are necessary or appropriate in carrying out its duties.
|
12.
|
DEFINITIONS
|
Capitalized terms used in this Charter have the meanings attributed to them below:
“Audit Committee Financial Expert” means a person who has the following attributes:
|
|
(a)
|
an understanding of generally accepted accounting principles and financial statements;
|
- 8 -
|
|
(b)
|
the ability to assess the general application of such principles in connection with the accounting for estimates, accruals and reserves;
|
|
|
(c)
|
experience preparing, auditing, analyzing or evaluating financial statements that present a breadth and level of complexity of accounting issues that are generally comparable to the breadth and complexity of issues that can reasonably be expected to be raised by Thomson Reuters financial statements, or experience actively supervising one or more person’s engaged in such activities;
|
|
|
(d)
|
an understanding of internal controls and procedures for financial reporting; and
|
|
|
(e)
|
an understanding of audit committee functions.
|
A person shall have acquired such attributes through:
|
|
(i)
|
education and experience as a principal financial officer, principal accounting officer, controller, public accountant or auditor or experience in one or more positions that involve the performance of similar functions;
|
|
|
(ii)
|
experience actively supervising a principal financial officer, principal accounting officer, controller, public accountant, auditor or person performing similar functions;
|
|
|
(iii)
|
experience overseeing or assessing the performance of companies or public accountants with respect to the preparation, auditing or evaluation of financial statements; or
|
|
|
(iv)
|
other relevant experience.
|
“Financially Literate” means the ability to read and understand a set of financial statements that present a breadth and level of complexity of accounting issues that are generally comparable to the breadth and complexity of the issues that can reasonably be expected to be raised by Thomson Reuters financial statements.
- 9 -