
SECURITIES AND
EXCHANGE COMMISSION
|
| Dated: February 26, 2001 | REUTERS GROUP PLC (Registrant) By: /s/ Nancy C. Gardner |
REUTERS [LOGO] Reuters Group PLC Reuters Group PLC |
Contents |
|
1 |
Reuters Group PLC
|
| 13 February 2001 | No. 04/01 |
| • | Revenue up 15% to £3.6 billion. |
| • | Significant step up in investment including business transformation costs of £139 million. |
| • | Net gains on disposals of £271 million. |
| • | PBT up 4% to £657 million. |
| • | EPS up 26% to 37.9p. |
| • | Strong cash generation. |
| • | Full year dividend up 9% to 16.0p. |
| • | Peter Job said “The Company’s business ended the year well, with every prospect of future growth under Tom Glocer.” |
|
2 |
Summary of ResultsThe following is a summary of the unaudited results of Reuters Group PLC (Nasdaq symbol: RTRSY) for the year to 31 December 2000: |
| Year to 31 December | % change | Year to 31 December | |||||||||||
| 2000 £m |
1999 £m |
Actual | Underlying | 2000 US$m |
1999 US$m |
||||||||
| Group revenue | 3,592 | 3,125 | 15 | % | 13 | % | 5,352 | 4,657 | |||||
| Operating profit | 411 | 549 | (25 | %) | (15 | %) | 612 | 818 | |||||
| Profit before taxation | 657 | 632 | 4 | % | 979 | 941 | |||||||
| Basic earnings per ordinary share | 37.9p | 30.2p | 26 | % | |||||||||
| Earnings per ADS | US$3.39 | US$2.70 | 26 | % | |||||||||
| Dividend per ordinary share: Interim | 3.65p | 3.65p | 0 | % | |||||||||
| Final | 12.35p | 11.0p | 12 | % | |||||||||
| Number of ordinary shares ranking for | |||||||||||||
| dividend (millions) | 1,405 | 1,402 | |||||||||||
|
Notes: |
| • | This summary is taken from, and should be read in conjunction with, the attached preliminary statement and notes. |
| • | Underlying growth excludes acquisitions and disposals and significant once-off items in the period under review and is stated at comparable exchange rates. |
| • | For convenience all US dollar equivalents have been converted throughout this news release at US$1.49 = £1, a rate prevailing on 31 December 2000. |
| • | The final dividend is payable on 26 April 2001 to ordinary shareholders on the register at 16 March 2001 and on 3 May 2001 to ADS holders on the register at 16 March 2001. |
| • | This news release includes forward-looking statements within the meaning of the US securities laws. For a discussion of factors that could affect future results, reference should be made to the forward-looking statements discussion and “Risk Factors” included in the full preliminary statement on pages 24 - 28. |
| • | The financial information for the year ended 31 December 1999 does not comprise statutory accounts but has been extracted from the statutory accounts of Reuters Group PLC for that year which have been delivered to the Registrar of Companies. The auditors’ report on the statutory accounts was unqualified and did not contain a statement made under section 237 (2) or (3) of the Companies Act 1985. The financial information for the year ended 31 December 2000 does not comprise statutory accounts within the meaning of section 240 of the Companies Act 1985. Statutory accounts of Reuters Group PLC for that period will be delivered to the Registrar of Companies in due course. |
| • | Reuters and the sphere logo are the trademarks of the Reuters Group of Companies. |
|
3 |
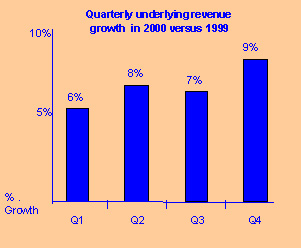
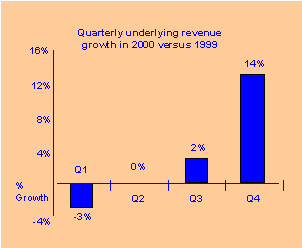
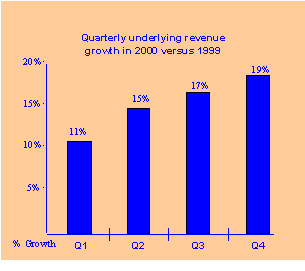
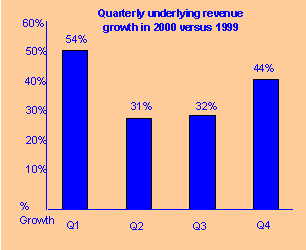
Within RF, Reuters Information revenue grew by 7% in overall terms and 8% on an underlying basis. This was driven by strong sales of our domestic and off trading floor products. In particular, sales of our US domestic equity product, Reuters Plus, topped 60,000 units in the year. By the end of the year we had sold more than 27,000 units of our flagship information product, 3000 Xtra, well in excess of our own targets. Also within RF, revenue from Reuters Trading Solutions (RTS) was up 5% in overall terms and 4% on an underlying basis. Underlying revenue from transaction products was down 2% in the year in line with recent trends. Underlying revenue from Applications and Enterprise Solutions rose 9% as sales of middleware and order routing solutions continued to recover from the millennium-induced slowdown. Underlying revenue from the sales of solutions to the providers of retail financial services grew 24%, albeit from a low base. Underlying RTS revenues grew 14% in the fourth quarter in part reflecting weak comparables in the previous year. ReuterspaceRevenue rose 50% to £235 million (US$350 million) in overall terms, reflecting the benefit of acquisitions made during the year. On an underlying basis, Reuterspace revenue was up 16%. Online media revenue more than doubled, but was partially offset by reduced revenue from television. Investments of £41 million (US$61 million) to develop opportunities in the corporate and retail markets contributed to an overall operating loss for Reuterspace of £67 million (US$100 million), versus £15 million (US$22 million) in 1999. The Greenhouse Fund contributed £53 million (US$79 million) to the Group’s net gains from the disposal of fixed asset investments bringing the cumulative total over four years to £127 million (US$189 million). The year-end market value of the fund’s 19 listed investments was £99 million (US$148 million) versus £438 million (US$653 million) last year, reflecting gains taken and the broad correction in valuations of technology stocks. The cost of the 71 unlisted investments was £219 million (US$326 million), of which £184 million (US$274 million) was invested during the year. While an IPO is no longer intended for the Greenhouse Fund, Reuters anticipates bringing in strategic investors. InstinetInstinet’s revenue rose 53% to £804 million (US$1,198 million) in overall terms and 40% on an underlying basis. In the US, underlying revenue was up 34% on strong volumes traded in the over-the-counter market. After a first quarter in which Instinet lost market share as a result of the explosion in retail and day trading activity it recovered market share to account for almost 10% of the combined New York Stock Exchange and Nasdaq trading volumes in the fourth quarter. On an underlying basis, international revenue rose 61% and now accounts for 24% of Instinet’s total. The overall growth in operating profit at Instinet, at 22%, was slower than the rate of revenue growth, reflecting investment in the development of the fixed income securities platform, which was launched during the year, and the development of the retail brokerage product. Total investment in these two initiatives in 2000 was £66 million (US$98 million). Based on a review of market conditions and an evaluation of alternative strategies, Instinet decided not to proceed with the launch of the retail brokerage offering. Instead, Instinet plans to offer the service through traditional and online securities brokers and through its wholesale operations. The process of floating a minority stake in Instinet was initiated with a US Securities and Exchange Commission filing last week. The IPO is expected to take place in the first half of the year. 5 |
Business TransformationA year ago Reuters announced a programme to invest a total of £500 million (US$745 million) to accelerate the migration to an Internet business model supported by web-enabled internal systems and processes. Within this it was estimated that the Group would spend £150 million (US$224 million) on a series of separately identified initiatives in each of 2000 and 2001. These initiatives have made good progress in their first year although the level of spending, at £139 million (US$207 million), was slightly less than originally estimated. Benefits, both in the form of top line growth and cost savings, are expected to emerge later this year and to accelerate through 2002. Reuters remains committed to the delivery of the £150 million (US$224 million) of cost savings originally envisaged and expects to see the majority of these flow through to profits and operating margins in 2002 with the full effect apparent in 2003. PartnersLast February Reuters confirmed a range of new initiatives designed to accelerate its use of Internet technologies and open new markets. An integral element of this plan was expansion of the Group’s capabilities through partnerships. Several ventures have been developed during the year and are proceeding according to plan. Radianz, the venture with Equant to form a secure extranet for the financial markets, is pushing ahead with the transfer of Reuters network resources. Multex Investor Europe, which provides broker research to the retail market, has made an encouraging start and another similar venture for Japan has been announced. Sila, a venture with Aether Systems has been set up to provide wireless services and technology to the European market. Factiva, the news database joint venture with Dow Jones, went into profit during the second half. Reuters share of losses from joint ventures and associates totalled £21 million (US$31 million) in the year and the Group expects to continue to invest in these strategically important and fast growth business opportunities. Prospects for 2001Reuters Financial had a strong end to 2000 and expects top line growth in the first half of 2001 to match the pace set in the second half of last year. Investment in Reuterspace is expected to continue at similar levels to that seen in 2000 and the Group plans to spend a further £150 million (US$224 million) on the business transformation initiatives in 2001. Equity market volumes, the principal driver of Instinet revenues, were strong at the start of 2001 with record days posted by Nasdaq in early January. END.6 |
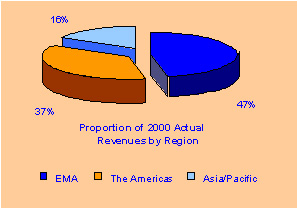
Revenue Analysis —Year to 31 December 2000 |
| Year to 31 December | % change | Year to 31 December | |||||||||||
| 2000 £m |
1999 £m |
Actual | Underlying | 2000 US$m |
1999 US$m |
||||||||
| Revenue analysis by division | |||||||||||||
| Reuters Information | 1,737 | 1,619 | 7% | 8% | 2,589 | 2,413 | |||||||
| Reuters Trading Solutions | 822 | 780 | 5% | 4% | 1,224 | 1,162 | |||||||
| Reuters Financial | 2,559 | 2,399 | 7% | 6% | 3,813 | 3,575 | |||||||
| Reuterspace | 235 | 157 | 50% | 16% | 350 | 234 | |||||||
| Instinet | 804 | 525 | 53% | 40% | 1,198 | 782 | |||||||
| Divisional revenue | 3,598 | 3,081 | 17% | 13% | 5,361 | 4,591 | |||||||
| TSI/RBB | — | 52 | — | — | — | 78 | |||||||
| Share of joint ventures revenue | 86 | 35 | — | — | 128 | 52 | |||||||
| Intra-group revenue | (6) | (8) | (16%) | (18%) | (9) | (12) | |||||||
| Gross revenue | 3,678 | 3,160 | 16% | 13% | 5,480 | 4,709 | |||||||
| Less share of joint ventures | |||||||||||||
| revenue | (86) | (35) | — | — | (128) | (52) | |||||||
| Group revenue | 3,592 | 3,125 | 15% | 13% | 5,352 | 4,657 | |||||||
| Revenue analysis by type | |||||||||||||
| Recurring | 2,537 | 2,338 | 9% | 6% | 3,780 | 3,484 | |||||||
| Usage | 863 | 609 | 42% | 30% | 1,286 | 908 | |||||||
| Outright | 192 | 178 | 8% | 9% | 286 | 265 | |||||||
| Total | 3,592 | 3,125 | 15% | 13% | 5,352 | 4,657 | |||||||
| Revenue analysis by | |||||||||||||
| geography | |||||||||||||
| Europe, Middle East and Africa | |||||||||||||
| (EMA) | 1,689 | 1,643 | 3% | 5% | 2,517 | 2,448 | |||||||
| The Americas | 1,344 | 979 | 37% | 23% | 2,002 | 1,459 | |||||||
| Asia/Pacific | 559 | 503 | 11% | 4% | 833 | 750 | |||||||
| Total | 3,592 | 3,125 | 15% | 13% | 5,352 | 4,657 | |||||||
|
Note: Share of joint ventures revenue excludes amounts invoiced to Reuters by Radianz 7 |
Revenue Analysis —Fourth Quarter 2000 |
| Three months to 31 December |
% change | Three months to 31 December | |||||||||||
| 2000 £m |
1999 £m |
Actual | Underlying | 2000 US$m |
1999 US$m |
||||||||
| Revenue analysis by division | |||||||||||||
| Reuters Information | 450 | 406 | 11% | 9% | 671 | 605 | |||||||
| Reuters Trading Solutions | 254 | 212 | 20% | 14% | 378 | 316 | |||||||
| Reuters Financial | 704 | 618 | 14% | 10% | 1,049 | 921 | |||||||
| Reuterspace | 72 | 42 | 71% | 19% | 107 | 62 | |||||||
| Instinet | 234 | 141 | 66% | 44% | 349 | 210 | |||||||
| Divisional revenue | 1,010 | 801 | 26% | 17% | 1,505 | 1,193 | |||||||
| Share of joint ventures revenue | 25 | 17 | 50% | 35% | 37 | 25 | |||||||
| Intra-group revenue | (2) | (1) | — | — | (3) | (1) | |||||||
| Gross revenue | 1,033 | 817 | 26% | 17% | 1,539 | 1,217 | |||||||
| Less share of joint ventures | |||||||||||||
| revenue | (25) | (17) | 50% | 35% | (37) | (25) | |||||||
| Group revenue | 1,008 | 800 | 26% | 17% | 1,502 | 1,192 | |||||||
| Revenue analysis by type | |||||||||||||
| Recurring | 666 | 590 | 13% | 9% | 994 | 879 | |||||||
| Usage | 250 | 155 | 62% | 47% | 372 | 231 | |||||||
| Outright | 92 | 55 | 64% | 59% | 136 | 82 | |||||||
| Total | 1,008 | 800 | 26% | 17% | 1,502 | 1,192 | |||||||
| Revenue analysis by | |||||||||||||
| geography | |||||||||||||
| Europe, Middle East and Africa | |||||||||||||
| (EMA) | 452 | 414 | 9% | 11% | 673 | 617 | |||||||
| The Americas | 395 | 255 | 55% | 37% | 589 | 380 | |||||||
| Asia/Pacific | 161 | 131 | 23% | 13% | 240 | 195 | |||||||
| Total | 1,008 | 800 | 26% | 17% | 1,502 | 1,192 | |||||||
|
Note: Share of joint venture excludes amounts invoiced to Reuters by Radianz 8 |
| 2000 £m |
1999 £m |
1998 £m |
|||||
| Revenue | 3,592 | 3,125 | 3,032 | ||||
| Operating profit - divisions | 609 | 603 | 611 | ||||
| - business transformation | (139) | — | — | ||||
| Normalised operating profit | 470 | 603 | 611 | ||||
| Tibco Software/Reuters Business Briefing | — | (7) | (15) | ||||
| Associates/Investment income | (16) | (1) | 7 | ||||
| Net interest receivable/(payable) | 3 | (4) | 2 | ||||
| Normalised PBT | 457 | 591 | 605 | ||||
| Goodwill amortisation | (71) | (61) | (51) | ||||
| Net gains on disposals | 271 | 102 | 26 | ||||
| Reported PBT | 657 | 632 | 580 | ||||
| Dividend per share | 16.0p | 14.65p | 14.4p | ||||
| Normalised EPS | 21.7p | 27.8p | 29.1p | ||||
| Basic EPS | 37.9p | 30.2p | 26.7p | ||||
|
Underlying growth excludes acquisitions and disposals and significant once-off items in the period under review and is stated at comparable exchange rates. Normalised profits and earnings exclude amortisation of goodwill and gains/losses on the disposal of subsidiaries and fixed asset investments. Actual revenue increased 15% to £3,592 million. Underlying revenue increased 13% in 2000, compared with 2% in 1999. Divisional profit before business transformation costs increased 1% in 2000 to £609 million, compared with a 1% fall in 1999. Underlying divisional operating profit growth in 2000 was 11%, compared to 3% in 1999. Divisional profit includes recognised net currency hedging gains which were £5 million in 2000, compared with £9 million in 1999 and £45 million in 1998. Actual rates performance in 2000 was adversely impacted by the strength of sterling against the Euro, partially offset by sterling’s weakness against the US dollar and Japanese yen. A year ago Reuters announced a programme to invest a total of £500 million to accelerate the migration to an Internet business model supported by web enabled internal systems and processes. Spend in 2000 amounted to £139 million (for further details, see page 11). Normalised operating profit, which includes business transformation costs, fell 21% in 2000 compared to a 1% fall in 1999. Normalised operating profit margin in 2000 was 13.1%, compared with a 19.3% margin in 1999 and 20.2% in 1998. Excluding business transformation costs, the normalised operating profit margin was 16.9% in 2000. Reuters share of net operating losses (before goodwill) in associates and joint ventures rose from £3 million in 1999 to £21 million in 2000. In 2000 a profit of £2 million from TIBCO Software Inc. (TSI) was more than offset by losses reported from the new joint ventures and associates Radianz, Sila and Multex Investor Europe. TSI and Reuters Business Briefing (RBB) became associated companies in 1999. In 1998 there was a profit of £4 million from associates and joint ventures. Income from fixed asset investments was £5 million in 2000 compared to £2 million in 1999 and £3 million in 1998. 9 |
The £3 million net interest income in 2000 reflected £13 million of interest receivable from associates and joint ventures and £10 million of net interest payable. This compared to a £4 million net interest expense in 1999 and £2 million net interest income in 1998. |
| £m | £m | ||||
| 1999 Normalised PBT | 591 | ||||
| Core Reuters | |||||
| Underlying growth in RF (+19%) | 83 | ||||
| Business transformation | (139) | ||||
| Investment in RS | (52) | ||||
| (108) | |||||
| Instinet | |||||
| Investment | (44) | ||||
| Underlying growth in equities (+44%) | 65 | ||||
| 21 | |||||
| Other movements | (47) | ||||
| 2000 Normalised PBT | 457 | ||||
|
Normalised profit before tax fell by 23% in 2000 to £457 million, compared with a decrease of 2% in 1999. The decline in 2000 reflected increased investment in new initiatives at Instinet and Reuterspace and business transformation costs, partly offset by higher underlying growth in Reuters Financial and Instinet’s Equities business. Reported profit before tax grew by 4% to £657 million in 2000, compared to an increase of 9% in 1999. Total goodwill amortisation in 2000 was £71 million, of which £12 million relates to associates and joint ventures. This compares to goodwill amortisation of £61 million in 1999 of which £14 million was in respect of associates and joint ventures. Goodwill amortisation in 1998 was £51 million of which £5 million was in respect of associates. Net gains on disposal were £271 million compared to £102 million in 1999 and £26 million in 1998. A follow-on public offering in March 2000 of 4.8 million TSI shares resulted in a book profit for Reuters of £160 million. This was subsequently reduced by £3 million as a result of the exercise of options held by TIBCO Finance employees. Reuters has sold no shares in TSI other than to meet its obligations under an option plan of TIBCO Finance, a wholly owned Reuters subsidiary, and received no proceeds from the sale of TSI shares other than the exercise price of such options. Profits on disposal of Greenhouse investments in 2000 were £83 million compared to £37 million in 1999 and £26 million in 1998. The profit in 2000 was offset in part by a write-down of £30 million to reflect a decline in the carrying value of certain investments. No write-downs were booked in 1999 or 1998. The disposal of Reuters interest in Safetynet generated a further profit of £37 million in 2000. Earnings before interest, taxation, depreciation and amortisation (EBITDA) declined 19% to £730 million on a normalised basis and fell 1% to £1,001 million on a reported basis. This compares with a fall in 1999 of 3% on a normalised basis and growth of 5% on a reported basis. The tax charge for 2000 is based on an effective tax rate of 17% on profit before goodwill amortisation, compared with a rate of 30% in 1999 (31% in 1998) and the current UK corporate tax rate of 30%. The lower effective tax rate reflects the beneficial tax consequences of the gain arising from the TSI follow-on share offer (on which no tax arises) and from tax deductions arising from the exercise of TSI stock options held by TIBCO Finance employees. The final dividend increased to 12.35p which, when added to the interim dividend of 3.65p per share, amounts to an increase of 9% for the full year. As announced in February 2000, during the period of business transformation, our dividend policy will be aligned to the results of Reuters Financial, comprising Reuters Information and Reuters Trading Solutions divisions. Basic earnings per share grew by 26% in 2000 compared to an increase of 13% in 1999. Normalised earnings per share decreased 22% in 2000 compared to a 5% decrease in 1999. 10 |
Business TransformationTransformation initiatives have been categorised into two groups: The development of a new product architecture that will create new personalised products for existing and new users along a continuum of price points that offer lower cost of ownership, segmented service and support, and a customer focused and rapid approach to product development. Organisation and process transformation that will create an organisation structure that is aligned to the emerging opportunities in each of our different customer segments supported by web enabled internal systems and processes that maximise the economies of our global scale. Business transformation spend was £139 million in 2000 compared to an original estimate of £150 million. This was made up of £88 million on new product architecture and £51 million on organisation and process transformation. Costs in 2000 were incremental to the existing base and included consultants, contractors and severance. Reuters anticipates a further spend of £150 million in 2001 and is committed to delivering £150 million of savings to the bottom line by 2003. Research and DevelopmentResearch and Development spend totalled £276 million in 2000 compared with £197 million in 1999 and £200 million in 1998. This expenditure excludes costs associated with business transformation. Of the total spend, £152 million related to Reuters Financial (1999: £146 million), £27 million to Reuterspace (1999: £5 million), £81 million to Instinet (1999: £41 million) and a further £16 million (1999: £5 million) related to the central Chief Technology Office (CTO). Activities in 2000 included enhancements to the data capture systems; redesign of the client-facing interface at Instinet; further development of the Fixed Income and Retail products at Instinet; the retail Personal Finance portal; and corporate security and software process improvements by the CTO. Cash Flow |
| Reuters Financial £m |
Reuterspace £m |
Instinet £m |
Total £m |
||||||
| Operating profit | 517 | (67) | 157 | 607 | |||||
| Depreciation | 216 | 14 | 46 | 276 | |||||
| Capex | (190) | (20) | (64) | (274) | |||||
| Working capital movements | (10) | 11 | 44 | 45 | |||||
| Divisional cash flow | 533 | (62) | 183 | 654 | |||||
| Cash conversion | 103% | (93%) | 117% | 108% | |||||
| Business transformation | (97) | ||||||||
| Acquisitions/Investments | (463) | ||||||||
| Disposals | 145 | ||||||||
| Dividends | (205) | ||||||||
| Taxation | (159) | ||||||||
| Other cash movements | 50 | ||||||||
| Net movement | (75) | ||||||||
|
Divisional cash conversion is the percentage of divisional operating profit, before business transformation costs, converted into cash. Strong performances were demonstrated by Reuters Financial and Instinet. 2. Operating performanceRevenue by type |
| Year to 31 December | |||||||
| 2000 % |
1999 % |
1998 % |
|||||
| Recurring | 71 | 75 | 73 | ||||
| Usage | 24 | 19 | 19 | ||||
| Outright | 5 | 6 | 8 | ||||
| Total | 100 | 100 | 100 | ||||
|
Recurring revenue is principally derived from the sale of subscription services. During the last three years over two thirds of recurring revenue was generated by Reuters Financial and the majority of the remainder within Reuterspace. Usage-based revenue is principally derived from Instinet and Reuters Financial’s Dealing 2000-2 product. The proportional increase in 2000 was attributable to the growth in Instinet revenues. Outright revenue comprises once-off Solution sales including information management systems and risk management software. The vast majority of this revenue was generated by Reuters Financial in each of the last three years. 11 |
Divisional PerformanceDivisional operating profit, as discussed below, excludes business transformation costs and goodwill. Net currency gain comprises profits on hedging activities offset by balance sheet revaluation losses. |
| Year to 31 December | |||||||
| 2000 £m |
1999 £m |
1998 £m |
|||||
| Reuters Information | 283 | 253 | 158 | ||||
| Reuters Trading Solutions | 234 | 230 | 286 | ||||
| Reuters Financial | 517 | 483 | 444 | ||||
| Reuterspace | (67) | (15) | (27) | ||||
| Instinet | 157 | 129 | 155 | ||||
| 607 | 597 | 572 | |||||
| Net currency gain | 2 | 6 | 39 | ||||
| Divisional operating profit | 609 | 603 | 611 | ||||
Reuters FinancialUnderlying operating profit grew by 19% in 2000 reflecting tight cost control partially balanced by parallel running in our technical centres as Reuters prepares for deployment of Internet technology and the build up of Reuters Consulting. The calculation of underlying profit excludes the beneficial impact in 1999 of the reversal of the £25 million data feed accrual. Reuters InformationReuters Information (RI) provides information products for finance professionals. The division’s focus is on four main markets: foreign exchange and money; commodities (including energy); fixed income and equities. |
| Year to 31 December | |||||||
| 2000 £m |
1999 £m |
1998 £m |
|||||
| Revenue | 1737 | 1619 | 1531 | ||||
| Operating profit | 283 | 253 | 158 | ||||
| Operating margin | 16.3% | 15.6% | 10.3% | ||||
| Year to 31 December | |||||||
| RI Revenue Analysis | 2000 £m |
1999 £m |
1998 £m |
||||
| High Tier (International products) | 795 | 775 | 746 | ||||
| Middle Tier (Domestic products) | 225 | 201 | 191 | ||||
| Lower Tier (off trading floor etc) | 24 | 12 | 6 | ||||
| Other revenue (site fees, exchange | |||||||
| fees, 3rd party data etc) | 693 | 631 | 588 | ||||
| Total revenue | 1,737 | 1,619 | 1,531 | ||||
|
Overall revenue growth of 7% was driven by strong sales in domestic and off trading floor products reflecting our strategy to broaden the revenue base beyond our high tier real-time users. Revenue growth in 1999 was 6%. High end revenues include 3000 Xtra, our new flagship product, which sold over 27,000 accesses with a number of notable major sales such as Merrill Lynch and Lehman Brothers. By 31 December 2000, we had installed 10,800 positions. Middle tier growth showed the success of our strategy in the US where Reuters Plus continued to do well with over 60,000 accesses sold by the end of 2000. 12 |
There was strong demand for our lower tier products. Reuters Investor was a major contributor to growth in the US and Europe. The 10% increase in Other revenue reflected the growth in demand for broader information sets and add on services. Approximately 40% of Other revenue was recovery of exchange, installation and communication fees for which there is an almost equal and opposite cost. On a geographic basis we saw strong underlying growth in The Americas (up 12%), Japan (up 7%) and in the main European geographies (up 8%). The operating margin continued to improve from 15.6% in 1999 to 16.3% in 2000 (1998: 10.3%). Strong revenue growth throughout the year and the continued tight control over costs both contributed to the margin improvement. Reuters Trading SolutionsReuters Trading Solutions (RTS) aims to meet the technology and transaction needs of clients in treasury and banking, corporate treasuries, securities broking and sales, asset management and personal financial services. RTS comprises three business groupings: Transactions, Applications and Enterprise Solutions and Retail Solutions. |
| Year to 31 December | |||||||
| 2000 £m |
1999 £m |
1998 £m |
|||||
| Revenue | 822 | 780 | 827 | ||||
| Operating profit | 234 | 230 | 286 | ||||
| Operating margin | 28.5% | 29.5% | 34.6% | ||||
|
Revenue declined in the first half of 2000 reflecting the low order book at the beginning of the year. The pick-up in orders following Y2K delivered improved growth in the second half resulting in actual revenue growth in 2000 of 5%. In 1999 there was a revenue decline of 6% actual and 5% on an underlying basis. Fourth quarter revenue growth was flattered by comparison to the equivalent quarter last year which was impacted by the pre-millennium slowdown. |
| Year to 31 December | |||||||
| RTS Revenue Analysis | 2000 £m |
1999 £m |
1998 £m |
||||
| Transactions | 402 | 402 | 429 | ||||
| Applications and Enterprise Solutions | 385 | 350 | 379 | ||||
| Retail Solutions | 35 | 28 | 19 | ||||
| Total revenue | 822 | 780 | 827 | ||||
|
Underlying revenue in Transactions fell 2% in 2000, compared to 7% in 1999, reflecting the continuing slow decline of the foreign exchange market. The roll out of Dealing 3000 is progressing well. Approximately 20% of the installed Dealing base had been upgraded by the end of the year. The fall in Conversational Dealing products revenue was offset by good growth in Dealing 2000-2 and sales of Automated Dealing Systems for the Treasury market. Applications and Enterprise Solutions (AES) revenues recovered from 1999 as predicted, driven by sales of middleware and order routing solutions, with particularly strong fourth quarter growth. Retail Solutions products for providers of personal financial services grew strongly, albeit off a low base. 13 |
Reuters Consulting was formed during the year to deliver integrated client solutions around a range of Reuters content and technology. Operating margins declined by 1% to 28.5% due to the change in mix of revenues and investments made in growth areas, notably Reuters Consulting and Retail Solutions. ReuterspaceThe Reuterspace (RS) strategy is to utilise existing Reuters assets to exploit new market opportunities beyond the traditional wholesale financial market. |
| Year to 31 December | |||||||
| 2000 £m |
1999 £m |
1998 £m |
|||||
| Revenue | 235 | 157 | 154 | ||||
| Operating loss | (67) | (15) | (27) | ||||
| Operating margin | (28.2%) | (9.4%) | (17.4%) | ||||
|
Underlying revenue growth of 16% in 2000 was driven primarily by growth in online media revenues. Underlying growth in 1999 was 9%. Actual revenue growth of 50% compared to 2% growth in 1999 was boosted by the acquisitions of The Tower Group (1999), The Yankee Group and ORTelematique (ORT). These acquisitions reflect the division’s strategy of building large scale business audiences seeking value added information and e-solutions. Increased investment in the Retail Finance Portals, Reuters.com and online media expansion as well as business incubation initiatives contributed to the higher loss in 2000. Branding costs also increased significantly, to £10 million from £1 million in 1999. The balance of operating losses in Reuterspace comprised the cost of operating the Greenhouse Fund and the central business development groups. The primary purpose of the Greenhouse Fund is to assist Reuters technology planning and to improve time to market of technology within the Reuters product offering. |
| Greenhouse Performance | 2000 £m |
1999 £m |
1998 £m |
||||
| Profits from disposals | 83 | 37 | 26 | ||||
| Write-down | (30) | — | — | ||||
| 53 | 37 | 26 | |||||
| Investments | |||||||
| Quoted at market value | 99 | 438 | 47 | ||||
| Unquoted at cost | 219 | 57 | 10 | ||||
|
In 2000, the Greenhouse Fund invested £184 million, comprising investment in 50 new companies and follow-on funding of existing investments, bringing the total number of investments to 90. A number of disposals were made in the year, realising a pre-tax profit of £83 million, up from £37 million in 1999 and £26 million in 1998. At 31 December 2000 the market value of quoted investments was £99 million, compared to £438 million at the end of 1999 and £47 million at the end of 1998. Unquoted investments cost £219 million, compared to £57 million in 1999 and £10 million in 1998. The write-down reflects the fact that the market value of certain quoted investments and the estimated value of some unquoted investments have fallen below their carrying value. While an IPO is no longer intended for the Greenhouse Fund, Reuters anticipates bringing in strategic investors. 14 |
InstinetInstinet provides global electronic equity and fixed income brokerage services to investment professionals. |
| Year to 31 December | |||||||
| 2000 £m |
1999 £m |
1998 £m |
|||||
| Revenue | 804 | 525 | 446 | ||||
| Operating profit | 157 | 129 | 155 | ||||
| Operating margin | 19.5% | 24.5% | 34.7% | ||||
|
Actual revenues increased 53% and underlying increased 40% in 2000. The 1999 growth was 18% and 15% respectively. The revenue split in 2000 was 76% US and 24% International. Underlying US revenue growth was 34% and International was 61%. US revenue growth was generated from increased volumes of equities traded and the expansion of the Instinet third party clearing services. The International revenue was predominantly generated from transactions in Europe. Instinet’s average share of the Nasdaq market was 13.7% for 2000 compared with 13.3% for 1999 and 14.3% for 1998. The average revenue per share traded in 2000 declined by 8%. Instinet’s Fixed Income product was launched in 2000 with revenues in the year of £3 million. Instinet decided not to proceed with the launch of its retail brokerage product. Instead, Instinet plans to offer the service through traditional and online securities brokers and through its wholesale operations. Operating margin declined to 19.5% from 24.5% in 1999 due to investment in the retail and Fixed Income products, investment in trading capacity to accommodate increased volumes and the build up of corporate costs prior to the initial public offering (IPO). On 8 February 2001, Instinet filed a registration statement with the US Securities and Exchange Commission with respect to the previously announced IPO of a minority stake. For information concerning certain rules that could affect Instinet’s business see Risk Factor: “Changes in regulatory requirements could cause Instinet and its affiliates to incur significant expenses or impair their ability to conduct their businesses” on page 27. Revenue by geography 15 |
| Year to 31 December | |||||||
| Revenue | 2000 £m |
1999 £m |
1998 £m |
||||
| EMA | 1,689 | 1,643 | 1,663 | ||||
| The Americas | 1,344 | 979 | 880 | ||||
| Asia/Pacific | 559 | 503 | 489 | ||||
| Total | 3,592 | 3,125 | 3,032 | ||||
|
Revenue growth in EMA in 2000 was 3% actual and 5% on an underlying basis compared to an actual 1% fall and an underlying increase of 1% in 1999. The biggest impetus of growth in this region was Instinet International which grew 61% on an underlying basis. Actual revenue growth in The Americas was 37% and 23% underlying in 2000 compared to an actual increase of 11% in 1999 and a 10% underlying increase. There was strong underlying revenue growth across the whole region but North America, in particular, grew 6%, and Instinet US grew 34%. Actual revenue growth in Asia/Pacific was 11% in 2000 compared with 3% in 1999. Underlying growth was 4% in 2000 compared with 4% decline in 1999. Underlying revenue growth in most countries was relatively flat except for Japan, which grew by 10%. Joint ventures and associatesExcluded from reported operating profit is the performance of a number of strategic alliances, joint ventures and minority stakes. The more significant of these include: Radianz, a joint venture with Equant NV that became operational from 1 July 2000, plans to develop the world’s largest secure Internet Protocol (IP) network for financial markets. Although Reuters owns 51% of the joint venture its control is limited to 50%. Reuters has contributed most of its network assets to Radianz. Reuters share of Radianz operating losses in 2000 was £9 million. TIBCO Software Inc. (TSI), a US publicly traded company which enables businesses to integrate enterprise application and deliver personalised information through enterprise portals, was spun off by Reuters in 1999. Reuters has a 57% economic interest in TSI but its voting rights are restricted to 49% and accordingly TSI is accounted for as an associate. If all outstanding employee options over TSI shares were exercised Reuters shareholding in TSI would be 42%. Reuters share of TSI’s profits in 2000 was £2 million (1999 £3 million loss). Factiva, a 50% owned joint venture with Dow Jones formed in 1999 that combines the businesses of Reuters Business Briefing and Dow Jones Interactive. Reuters share of Factiva’s losses in 2000 was £1 million, compared with £4 million in 1999. Multex Investor Europe, a 50% owned joint venture with Multex.com Inc. formed in February 2000 to provide dedicated broker research and investment information to private investors in Europe. Reuters share of Multex Investor Europe losses were £4 million in the year. Reuters holds a 6.2% stake in Multex.com Inc. In addition Multex Investor Japan, a 50% owned joint venture with Multex.com Inc, was formed in February 2001 to provide similar services in Japan. Atriax, a consortium formed in late 2000, owned 25% by Reuters, aims to become the premier e-marketplace for foreign exchange by bringing together the world’s liquidity providers offering institutional and corporate services. Sila Communications, a 40% owned venture with Aether Systems created in May 2000 to provide wireless data service in Europe. Reuters share of Sila’s losses in 2000 was £7 million. Reuters owns a 7.2% interest in Aether Systems. 16 |
Consolidated Profit and Loss Account for the year to 31 December 2000 (unaudited) |
| Year to 31 December | Year to 31 December | ||||||||
| 2000 £m |
1999 £m |
2000 US$m |
1999 US$m |
||||||
| Gross revenue | 3,678 | 3,160 | 5,480 | 4,709 | |||||
| Less share of joint ventures revenue | (86) | (35) | (128) | (52) | |||||
| Group revenue | 3,592 | 3,125 | 5,352 | 4,657 | |||||
| Operating costs | (3,181) | (2,576) | (4,740) | (3,839) | |||||
| Operating profit | 411 | 549 | 612 | 818 | |||||
| Operating result from joint ventures | (17) | (6) | (26) | (10) | |||||
| Operating result from associates | (16) | (11) | (23) | (16) | |||||
| Profit on disposal of fixed assets/investments | 291 | 50 | 435 | 75 | |||||
| Profit on disposal of subsidiary undertakings | 10 | 52 | 14 | 78 | |||||
| Amounts written off fixed asset investments | (30) | — | (45) | — | |||||
| Income from fixed asset investments | 5 | 2 | 7 | 2 | |||||
| Net interest receivable/(payable) | 3 | (4) | 5 | (6) | |||||
| Profit on ordinary activities before taxation | 657 | 632 | 979 | 941 | |||||
| Taxation on profit on ordinary activities | (125) | (207) | (186) | (308) | |||||
| Profit after taxation attributable to ordinary | |||||||||
| shareholders | 532 | 425 | 793 | 633 | |||||
| Dividend | |||||||||
| - Interim | (51) | (52) | (76) | (77) | |||||
| - Final | (173) | (154) | (258) | (230) | |||||
| Retained profit | 308 | 219 | 459 | 326 | |||||
| Basic earnings per ordinary share | 37.9p | 30.2p | |||||||
Consolidated Statement of Total Recognised Gains and Losses for the year to 31 December 2000 (unaudited) |
| Year to 31 December | Year to 31 December | ||||||||
| 2000 £m |
1999 £m |
2000 US$m |
1999 US$m |
||||||
| Profit after taxation attributable to ordinary | |||||||||
| shareholders | 532 | 425 | 793 | 633 | |||||
| Unrealised gain on formation of joint ventures and | |||||||||
| associates | 73 | — | 109 | — | |||||
| Unrealised gain on deemed disposal of | |||||||||
| associate | 39 | — | 58 | — | |||||
| Unrealised gain on disposal of fixed asset | |||||||||
| investments (net of tax of £3 million) | 13 | — | 20 | — | |||||
| Translation differences taken directly to | |||||||||
| reserves | 40 | 10 | 60 | 15 | |||||
| Total recognised gains and losses relating | |||||||||
| to the year | 697 | 435 | 1,040 | 648 | |||||
|
17 |
Consolidated Cash Flow Statement for the year to 31 December 2000 (unaudited) |
| Year to 31 December | Year to 31 December | ||||||||
| 2000 £m |
1999 £m |
2000 US$m |
1999 US$m |
||||||
| Net cash inflow from operating activities | 852 | 821 | 1,268 | 1,224 | |||||
| Dividends received from associates | 2 | 2 | 3 | 3 | |||||
| Returns on investments and servicing of finance | |||||||||
| Interest received | 25 | 50 | 37 | 75 | |||||
| Interest paid | (35) | (51) | (52) | (76) | |||||
| Income from fixed asset investments | 3 | 2 | 6 | 2 | |||||
| Net cash (outflow)/inflow from returns on | |||||||||
| investments and servicing of finance | (7) | 1 | (9) | 1 | |||||
| Taxation paid | (159) | (167) | (237) | (249) | |||||
| Capital expenditure and financial investments | |||||||||
| Purchase of tangible fixed assets | (274) | (256) | (408) | (382) | |||||
| Sale of tangible fixed assets | 20 | 1 | 30 | 1 | |||||
| Purchase of fixed asset investments | (304) | (166) | (451) | (247) | |||||
| Sale of fixed asset investments | 80 | 39 | 119 | 59 | |||||
| Net cash outflow on capital expenditure and | |||||||||
| financial investments | (478) | (382) | (710) | (569) | |||||
| Acquisitions and disposals (including | |||||||||
| associates) | (146) | (27) | (218) | (41) | |||||
| Equity dividends paid | (205) | (207) | (306) | (308) | |||||
| Cash (outflow)/inflow before management of | |||||||||
| liquid resources and financing | (141) | 41 | (209) | 61 | |||||
| Management of liquid resources | |||||||||
| Net (increase)/decrease in short-term | |||||||||
| investments | (2) | 476 | (3) | 709 | |||||
| Financing | |||||||||
| Proceeds from issue of shares | 28 | 25 | 41 | 37 | |||||
| Shares repurchased | — | (25) | — | (37) | |||||
| Net increase/(decrease) in borrowings | 126 | (542) | 187 | (808) | |||||
| Net cash inflow/(outflow) from financing | 154 | (542) | 228 | (808) | |||||
| Increase/(decrease) in cash | 11 | (25) | 16 | (38) | |||||
|
18 |
Reconciliation of Net Cash Flow to Movement in Net Funds (unaudited) |
| Year to 31 December | Year to 31 December | ||||||||
| 2000 £m |
1999 £m |
2000 US$m |
1999 US$m |
||||||
| Increase/(decrease) in cash | 11 | (25) | 16 | (38) | |||||
| Cash (inflow)/outflow from movement in | |||||||||
| borrowings | (126) | 542 | (187) | 808 | |||||
| Cash outflow/(inflow) from movement in liquid | |||||||||
| resources | 2 | (476) | 3 | (709) | |||||
| Change in net funds resulting from cash flows | (113) | 41 | (168) | 61 | |||||
| Net funds arising on acquisitions | 12 | — | 18 | — | |||||
| Translation differences | 26 | 3 | 39 | 4 | |||||
| Movement in net funds | (75) | 44 | (111) | 65 | |||||
| Opening net funds/(debt) | 41 | (3) | 61 | (4) | |||||
| Closing net (debt)/funds | (34) | 41 | (50) | 61 | |||||
Net Cash Inflow from Operating Activities (unaudited) |
| Year to 31 December | Year to 31 December | ||||||||
| 2000 £m |
1999 £m |
2000 US$m |
1999 US$m |
||||||
| Operating profit | 411 | 549 | 612 | 818 | |||||
| Depreciation | 276 | 310 | 411 | 462 | |||||
| Goodwill amortisation | 59 | 47 | 88 | 70 | |||||
| (Increase)/decrease in stocks | (3) | 1 | (4) | 2 | |||||
| Increase in debtors | (414) | (236) | (617) | (352) | |||||
| Increase in creditors | 504 | 112 | 752 | 167 | |||||
| Loss on disposal of fixed assets | 10 | 12 | 15 | 18 | |||||
| Amortisation of interests in own shares | 18 | 18 | 27 | 27 | |||||
| Miscellaneous, principally translation differences | (9) | 8 | (16) | 12 | |||||
| Net cash inflow from operating activities | 852 | 821 | 1,268 | 1,224 | |||||
|
19 |
Consolidated Balance Sheet at 31 December 2000 (unaudited) |
| 31 December | 31 December | ||||||||
| 2000 £m |
1999 £m |
2000 US$m |
1999 US$m |
||||||
| Fixed assets | 1,868 | 1,205 | 2,782 | 1,796 | |||||
| Net current assets | |||||||||
| Stocks | 7 | 4 | 11 | 6 | |||||
| Debtors | 1,297 | 834 | 1,933 | 1,243 | |||||
| Cash and short-term investments | 647 | 609 | 964 | 908 | |||||
| Creditors | (2,295) | (1,679) | (3,419) | (2,502) | |||||
| Net current liabilities | (344) | (232) | (511) | (345) | |||||
| Provisions | (34) | (26) | (51) | (39) | |||||
| Long-term creditors | (388) | (346) | (578) | (517) | |||||
| Net assets | 1,102 | 601 | 1,642 | 895 | |||||
| Capital and reserves | |||||||||
| Called-up share capital and share premium | 428 | 397 | 638 | 592 | |||||
| Capital redemption reserve | 1 | 1 | 2 | 2 | |||||
| Other reserve | (1,717) | (1,717) | (2,560) | (2,560) | |||||
| Profit and loss account reserve | 2,390 | 1,920 | 3,562 | 2,861 | |||||
| Shareholders’ equity | 1,102 | 601 | 1,642 | 895 | |||||
Reconciliation of Movements in Shareholders’ Funds for the year to 31 December 2000 (unaudited) |
| Year to 31 December | Year to 31 December | ||||||||
| 2000 £m |
1999 £m |
2000 US$m |
1999 US$m |
||||||
| Retained profit | 308 | 219 | 459 | 326 | |||||
| Translation differences taken directly to | |||||||||
| reserves | 40 | 10 | 60 | 15 | |||||
| Unrealised gain on formation of joint ventures and | |||||||||
| associates | 73 | — | 109 | — | |||||
| Unrealised gain on deemed disposal of | |||||||||
| associate | 39 | — | 58 | — | |||||
| Unrealised gain on disposal of fixed asset | |||||||||
| investments | 13 | — | 20 | — | |||||
| Shares issued during the year | 28 | 25 | 41 | 37 | |||||
| Shares repurchased during the year | — | (25) | — | (37) | |||||
| Net movement in shareholders’ equity | 501 | 229 | 747 | 341 | |||||
| Opening shareholders’ equity | 601 | 372 | 895 | 554 | |||||
| Closing shareholders’ equity | 1,102 | 601 | 1,642 | 895 | |||||
|
20 |
| Year to 31 December | Year to 31 December | ||||||||||
| By division | 2000 £m |
1999 £m |
% change | 2000 US$m |
1999 US$m |
||||||
| Revenue | |||||||||||
| Reuters Information | 1,737 | 1,619 | 7% | 2,589 | 2,413 | ||||||
| Reuters Trading Solutions | 822 | 780 | 5% | 1,224 | 1,162 | ||||||
| Reuters Financial | 2,559 | 2,399 | 7% | 3,813 | 3,575 | ||||||
| Reuterspace | 235 | 157 | 50% | 350 | 234 | ||||||
| Instinet | 804 | 525 | 53% | 1,198 | 782 | ||||||
| Divisional revenue | 3,598 | 3,081 | 17% | 5,361 | 4,591 | ||||||
| TSI/RBB | — | 52 | — | — | 78 | ||||||
| Share of joint ventures revenue | 86 | 35 | — | 128 | 52 | ||||||
| Intra-group revenue | (6) | (8) | (16%) | (9) | (12) | ||||||
| Gross revenue | 3,678 | 3,160 | 16% | 5,480 | 4,709 | ||||||
| Less share of joint ventures revenue | (86) | (35) | — | (128) | (52) | ||||||
| Group revenue | 3,592 | 3,125 | 15% | 5,352 | 4,657 | ||||||
|
21 |
2. Segmental Analysis (continued) |
| Year to 31 December | Year to 31 December | ||||||||||
| By division | 2000 £m |
1999 £m |
% change | 2000 US$m |
1999 US$m |
||||||
| Costs | |||||||||||
| Reuters Information | (1,454) | (1,366) | 7% | (2,168) | (2,037) | ||||||
| Reuters Trading Solutions | (588) | (550) | 7% | (875) | (819) | ||||||
| Reuters Financial | (2,042) | (1,916) | 7% | (3,043) | (2,856) | ||||||
| Reuterspace | (302) | (172) | 76% | (450) | (256) | ||||||
| Instinet | (647) | (396) | 63% | (964) | (590) | ||||||
| Divisional costs | (2,991) | (2,484) | 20% | (4,457) | (3,702) | ||||||
| TSI/RBB | — | (59) | — | — | (88) | ||||||
| Business transformation costs | (139) | — | — | (207) | — | ||||||
| Intra-group costs | 6 | 8 | (16%) | 9 | 12 | ||||||
| Group costs | (3,124) | (2,535) | 23% | (4,655) | (3,778) | ||||||
| Divisional profit | |||||||||||
| Reuters Information | 283 | 253 | 12% | 421 | 376 | ||||||
| Reuters Trading Solutions | 234 | 230 | 2% | 349 | 343 | ||||||
| Reuters Financial | 517 | 483 | 7% | 770 | 719 | ||||||
| Reuterspace | (67) | (15) | 346% | (100) | (22) | ||||||
| Instinet | 157 | 129 | 22% | 234 | 192 | ||||||
| Net currency gain | 2 | 6 | (67%) | 3 | 9 | ||||||
| Divisional profit | 609 | 603 | 1% | 907 | 898 | ||||||
| Business transformation costs | (139) | — | — | (207) | — | ||||||
| TSI/RBB | — | (7) | — | — | (10) | ||||||
| Total | 470 | 596 | (21%) | 700 | 888 | ||||||
| Goodwill | |||||||||||
| Reuters Information | (14) | (13) | 4% | (21) | (19) | ||||||
| Reuters Trading Solutions | (20) | (26) | (23%) | (30) | (39) | ||||||
| Reuters Financial | (34) | (39) | (14%) | (51) | (58) | ||||||
| Reuterspace | (14) | (3) | 367% | (21) | (4) | ||||||
| Instinet | (11) | (5) | 147% | (16) | (8) | ||||||
| Total goodwill | (59) | (47) | 26% | (88) | (70) | ||||||
| Operating profit | 411 | 549 | (25%) | 612 | 818 | ||||||
|
22 |
3. US GAAPUK GAAP differ in certain significant respects from US GAAP. A discussion of the relevant accounting principles which differ materially is given on page 75 of Reuters Group PLC 1999 annual report. The following are the adjustments required to reconcile UK GAAP with US GAAP. |
| Year to 31 December | |||||
| Adjustments to net income | 2000 £m |
1999 £m |
|||
| Profit attributable to ordinary shareholders in accordance with UK GAAP | 532 | 425 | |||
| US GAAP adjustments: | |||||
| - software revenue recognition | (6) | 2 | |||
| - capitalised website development costs | 3 | — | |||
| - amortisation of software development costs | (2) | (2) | |||
| - associated undertakings | (16) | — | |||
| - gains on deemed disposal of associated undertaking | 25 | — | |||
| - gain on exchange of investments | 16 | — | |||
| - goodwill and other acquisition accounting adjustments | (3) | (2) | |||
| - employee costs | (22) | (8) | |||
| - income taxes | |||||
| application of FAS 109 | (1) | 35 | |||
| tax effect of US GAAP adjustments | 8 | 1 | |||
| Net income in accordance with US GAAP | 534 | 451 | |||
| Statement of comprehensive income | £m | £m | |||
| Net income in accordance with US GAAP | 534 | 451 | |||
| Other comprehensive income, net of tax: | |||||
| Unrealised (losses)/gains on certain fixed asset investments: | |||||
| - arising during year | (270) | 425 | |||
| - less realised gains taken to net income | (43) | (10) | |||
| Foreign currency translation differences | 40 | 10 | |||
| Comprehensive income in accordance with US GAAP | 261 | 876 | |||
| £m | £m | ||||
| Total assets under US GAAP | 3,783 | 3,173 | |||
| Total shareholders’ equity under US GAAP | 1,186 | 1,109 | |||
| Earnings and dividends | pence | pence | |||
| Basic earnings per ADS in accordance with US GAAP | 228.1 | 192.1 | |||
| Diluted earnings per ADS in accordance with US GAAP | 224.3 | 189.5 | |||
| Dividend paid per ADS (including UK advance corporation tax credit) | 97.7 | 97.7 | |||
|
23 |
Reuters is exposed to a decline in the market valuation of Internet and technology companies, including companies in which it has investedReuters strategy is based on developing Internet-based products and reducing costs through Internet-based infrastructure. Due to the increasing importance of the internet to Reuters core business, the value of Reuters shares may be adversely affected by a decline in the value of Internet and other technology stocks generally or changes in investors’ expectations regarding the Internet or prospects for companies with Internet activities. In addition, Reuters has entered into joint ventures with, and made strategic investments in, a number of Internet and technology companies, including investments made through the Greenhouse Fund in Internet-related companies. The market value of a number of these companies has fluctuated widely and generally decreased during 2000, in part as a result of external market factors. In particular, the market value of Reuters interest in TIBCO Software Inc. during 2000 (excluding shares subject to employee options) varied from a high of $14 billion to a low of $3 billion. In addition, as described below, Reuters subsidiary, Instinet, is progressing towards an IPO of a minority stake. The value of Reuters interests in these companies is dependent on, among other things, the performance of these companies generally, whether such performance meets investors’ expectations, and external market and economic conditions. Reuters may not be able to realise the anticipated benefits of its Internet transformation strategyIn February 2000, Reuters announced a business transformation initiative, intended to accelerate the migration of its core businesses to web-enabled internal systems and processes. In 2000, expenditures in connection with the transformation amounted to £139 million. Reuters expects to make significant additional expenditures of £150 million on business transformation in 2001. While Reuters expects that the transformation will produce significant competitive advantages and cost savings, there can be no assurance that these benefits will be realised in full or at all. In addition, Reuters may not be able to successfully implement its transformation strategy or adapt its businesses to Internet commerce. Furthermore, Reuters faces risks associated with implementing its new business model in the competitive and rapidly changing Internet environment. Reuters may experience difficulties or delays in developing new technologyProducts in the information technology industry are complex and Reuters is becoming increasingly dependent on commercial off-the-shelf software. As a result, Reuters, like other information vendors and software suppliers, may encounter difficulties or delays in the development, implementation and market acceptance of new products. Reuters business model may be disrupted by the emergence of new technologies There is a risk that technology not in the mainstream will quickly enter the market and disrupt Reuters existing business models. Reuters has an active technology foresight programme, designed to recognise and assess early innovations. However, there can be no assurance that Reuters reaction will be appropriate and timely and that Reuters would not be negatively affected by the emergence of new technologies. 25 |
Reuters business is dependent on the operation of its and Radianz’s networks and systemsReuters business is dependent on its ability to process speedily substantial quantities of data and transactions on its computer-based networks and systems and those of Radianz. Any failure or interruption of such systems due to factors beyond Reuters control would have a material adverse effect on Reuters business and results of operations. Although Reuters seeks to minimise these risks as far as commercially reasonable through security controls and active business continuity programmes, there can be no assurance that adverse events will not occur. Reuters business will be adversely affected if it cannot accommodate increased network trafficThe US Securities and Exchange Commission (SEC) is requiring the US securities industry to change the pricing format under which stocks and options are traded from fractions to decimals. These requirements are expected to be completed by April 2001. In addition to decimalisation, market events such as the emergence of online trading throughout Europe and the United States, high market volatility, and the multiple listing of options, will likely result in a significant increase in information update rates, which may impact Reuters product and network performance from time to time. While Reuters has implemented a number of capacity management initiatives, there can be no assurance that its infrastructure, networks and desktop applications and systems will be able to successfully accommodate the accelerated growth of peak traffic volumes currently forecast by industry specialists. Reuters may not be able to complete successfully the planned IPO of Instinet and may be exposed to increased volatility if the IPO is completedReuters has announced that its subsidiary, Instinet, has filed a registration statement with the SEC in the US for an initial public offering of a minority stake. However, Reuters can give no assurance that Instinet will succeed in completing the IPO, which may be adversely affected by market conditions, regulatory decisions or other factors. If the IPO is delayed or not completed, Reuters results of operations may be adversely affected because it will have already incurred costs in connection with its preparation. In addition, Reuters may not realise the anticipated proceeds from the IPO or other benefits, including a market valuation of its interest in Instinet. Reuters also can give no assurance regarding the level of the initial offering price or the market performance of Instinet shares after the IPO, if completed. Reuters shares may experience additional volatility following an Instinet IPO as a result of changes in the price of Instinet shares. Instinet and other Reuters affiliates may be exposed to losses from broker activitiesCertain Reuters subsidiaries act as brokers in the financial markets but do not undertake trading on their own account. Companies within the Instinet group operate as agency brokers in the equities and fixed income markets and as a clearing firm engaged in correspondent clearing. In addition, Reuters Transaction Services Limited (RTSL) operates the Dealing 2000-2 and 3000 electronic brokerage services. These brokers could incur losses from broken trades and, in respect of equities and fixed income, the failure of a counterparty. While Reuters and Instinet seek to mitigate these risks by computerised systems, procedural controls and contractual agreements with customers, there can be no assurance that these measures will prevent losses from occurring. 26 |
Changes in regulatory requirements could cause Instinet and its affiliates to incur significant expenses or impair their ability to conduct their businessesInstinet and its affiliates are subject to extensive regulation in the United States, including regulation by the SEC and the National Association of Securities Dealers Inc. (NASD), which oversees the activities of US registered broker-dealers and regulates the Nasdaq stock market, and in other countries in which they operate. In the United States, recent regulatory changes affecting Instinet include new rules regarding “alternative trading systems” and rules governing market-maker and exchange specialist usage. In addition, on 10 January 2001, the SEC approved a proposed NASD rule change, generally referred to as Super-Montage, which will significantly change the nature of trading in Nasdaq quoted securities. These changes could cause Instinet to receive fewer orders in Nasdaq-quoted securities, which are the largest component of Instinet’s equity securities business, and also could cause fewer of the orders Instinet receives to be executed. Further, new SEC rules such as the disclosures of order routing and execution practices and the SEC mandated move to decimalisation in April 2001 would require Instinet to modify its systems and may significantly affect its business. Reuters is unable to predict accurately, at this time, the impact of any proposed or potential changes to the regulatory environment in which Instinet and its affiliates operate, which may include additional changes to the Nasdaq marketplace considered by the NASD or the adoption by authorities in other jurisdictions of new methods for regulating electronic over-the-counter trading. Any of the above or other regulatory changes may cause Instinet and its affiliates to incur substantial compliance costs or may impair their ability to conduct their businesses or to compete effectively. Reuters does not have management control over some of its venturesReuters has entered into a number of joint ventures, which it does not control, such as the recently formed Radianz joint venture. In addition, Reuters does not have management control over a number of companies in which it has invested, including TSI, where Reuters voting interests are restricted to 49%. Although Reuters generally seeks board representation or other means of participating in the management of companies or joint ventures in which it invests, Reuters ability to affect the performance of these companies or joint ventures may be limited where it does not exercise management control. Reuters is dependent on Radianz for the provision of certain network servicesReuters has outsourced the day to day operation of most of its legacy and Internet Protocol networks to Radianz, its new joint venture with Equant. Radianz will source the majority of its requirements from Equant and will seek to provide network services to companies in addition to Reuters and Instinet. Reuters and Equant are equally represented on the Radianz board with neither party having control. Accordingly, Reuters ability to affect the performance of Radianz may be limited should Reuters and Radianz develop conflicting network strategies in the future. Our business could be adversely affected as a result. 27 |
Reuters may be exposed to adverse governmental action in countries where it conducts reporting activitiesAs the world’s largest news and information agency, Reuters may suffer discriminatory tariffs or other forms of adverse government intervention due to the nature of its editorial and other reporting activities. 28 |
General Statistics |
| December 2000 |
% change | December 1999 |
|||||
| Total subscriber locations (000s) | 50.6 | (4%) | 52.8 | ||||
| Information sources: | |||||||
| - contributors | 5,036 | 1% | 5,001 | ||||
| - markets reported in real time | 263 | 1% | 260 | ||||
| - journalists | 2,157 | 3% | 2,101 | ||||
| - bureaux | 190 | 3% | 184 | ||||
| Infrastructures: | |||||||
| - countries in which services distributed | 151 | (2%) | 154 | ||||
| - countries with offices | 100 | 3% | 97 | ||||
| - cities with offices | 204 | (4%) | 212 | ||||
| Staff numbers | 18,082 | 9% | 16,546 | ||||
| Financial Ratios | December 2000 |
December 1999 |
|||
| Operating margin | 11.4% | 17.6% | |||
| Pre-tax margin | 18.3% | 20.2% | |||
| Post-tax margin | 14.8% | 13.6% | |||
| EBITDA margin | 27.9% | 32.2% | |||
| Earnings per share | 37.9p | 30.2p | |||
| Free cash flow per ordinary share | 31.0p | 28.4p | |||
| Book value per ordinary share | 70.1p | 36.1p | |||
| Return on tangible fixed assets | 79.9% | 57.5% | |||
| Return on equity | 71.4% | 102.0% | |||
|
The financial ratios are derived from UK GAAP data. 29 |
The definitions applied to each of the financial ratios are as follows: EBITDA margin represents earnings before interest, taxation, depreciation and amortisation of goodwill as a percentage of turnover. Free cash flow per ordinary share represents operating cash flow, net interest and other investment income received less tax paid and expenditure on tangible fixed assets divided by the weighted average number of shares. Book value per ordinary share represents adjusted shareholders’ equity divided by the number of shares in issue after deducting shares of Reuters Group PLC held by ESOTs. Adjusted shareholders’ equity is calculated after deducting the carrying value of interests in shares of Reuters Group PLC held by ESOTs. Return on tangible fixed assets represents the annualised profit after taxation as a percentage of average tangible fixed assets. The average is calculated by adding tangible fixed assets at the start and the end of each period and dividing by two. Return on equity represents annualised profit attributable to ordinary shareholders divided by the average adjusted shareholders’ equity for the period. 30 |
Summary of Results |
| £m | 2000 | 1999 | |||||||||||||||
|---|---|---|---|---|---|---|---|---|---|---|---|---|---|---|---|---|---|
| Revenue | Q1 | Q2 | Q3 | Q4 | Q1 | Q2 | Q3 | Q4 | |||||||||
| Reuters Information | |||||||||||||||||
| EMA | 246 | 245 | 257 | 260 | 247 | 243 | 243 | 241 | |||||||||
| The Americas | 91 | 103 | 97 | 104 | 83 | 86 | 87 | 87 | |||||||||
| Asia/Pacific | 80 | 84 | 84 | 86 | 75 | 74 | 75 | 78 | |||||||||
| Total | 417 | 432 | 438 | 450 | 405 | 403 | 405 | 406 | |||||||||
| Reuters Trading Solutions | |||||||||||||||||
| Transactions | 101 | 103 | 99 | 99 | 102 | 100 | 101 | 100 | |||||||||
| Applications and Enterprise | |||||||||||||||||
| Solutions | 66 | 86 | 87 | 146 | 78 | 87 | 82 | 102 | |||||||||
| Retail Solutions | 9 | 7 | 10 | 9 | 5 | 7 | 6 | 10 | |||||||||
| Total | 176 | 196 | 196 | 254 | 185 | 194 | 189 | 212 | |||||||||
| Reuters Financial | 593 | 628 | 634 | 704 | 590 | 597 | 594 | 618 | |||||||||
| Reuterspace | 43 | 54 | 66 | 72 | 37 | 37 | 41 | 42 | |||||||||
| Instinet | |||||||||||||||||
| US | 141 | 141 | 146 | 186 | 98 | 102 | 99 | 108 | |||||||||
| International | 56 | 43 | 43 | 48 | 27 | 28 | 30 | 33 | |||||||||
| Total | 197 | 184 | 189 | 234 | 125 | 130 | 129 | 141 | |||||||||
| TSI/RBB | — | — | — | — | 23 | 29 | — | — | |||||||||
| Intra-group revenue | (1) | (2) | (1) | (2) | (4) | (2) | (1) | (1) | |||||||||
| Total revenue | 832 | 864 | 888 | 1008 | 771 | 791 | 763 | 800 | |||||||||
| Adjustment for TSI/RBB | — | — | — | — | (23) | (29) | — | — | |||||||||
| Adjustment for Intra-group | |||||||||||||||||
| revenue | 1 | 2 | 1 | 2 | 4 | 2 | 1 | 1 | |||||||||
| Divisonal revenue | 833 | 866 | 889 | 1010 | 752 | 764 | 764 | 801 | |||||||||
|
31 |
| £m | 2000 | 1999 | |||||||||||
|---|---|---|---|---|---|---|---|---|---|---|---|---|---|
| Costs | H1 | H2 | FY | H1 | H2 | FY | |||||||
| Reuters Information | (702) | (752) | (1,454) | (694) | (672) | (1,366) | |||||||
| Reuters Trading Solutions | (271) | (317) | (588) | (262) | (288) | (550) | |||||||
| Reuters Financial | (973) | (1,069) | (2,042) | (956) | (960) | (1,916) | |||||||
| Reuterspace | (120) | (182) | (302) | (79) | (93) | (172) | |||||||
| Instinet | (297) | (350) | (647) | (175) | (221) | (396) | |||||||
| TSI/RBB | — | — | — | (59) | — | (59) | |||||||
| Intra-group costs | 3 | 3 | 6 | 6 | 2 | 8 | |||||||
| Total costs | (1,387) | (1,598) | (2,985) | (1,263) | (1,272) | (2,535) | |||||||
| Adjustment for Intra-group costs | (3) | (3) | (6) | (6) | (2) | (8) | |||||||
| Adjustment for TSI/RBB | — | — | — | 59 | — | 59 | |||||||
| Divisional costs | (1,390) | (1,601) | (2,991) | (1,210) | (1,274) | (2,484) | |||||||
| Divisional profit | |||||||||||||
| Reuters Information | 147 | 136 | 283 | 114 | 139 | 253 | |||||||
| Reuters Trading Solutions | 101 | 133 | 234 | 117 | 113 | 230 | |||||||
| Reuters Financial | 248 | 269 | 517 | 231 | 252 | 483 | |||||||
| Reuterspace | (23) | (44) | (67) | (5) | (10) | (15) | |||||||
| Instinet | 84 | 73 | 157 | 80 | 49 | 129 | |||||||
| Total | 309 | 298 | 607 | 306 | 291 | 597 | |||||||
| Net currency gain | 3 | (1) | 2 | 3 | 3 | 6 | |||||||
| Divisional profit | 312 | 297 | 609 | 309 | 294 | 603 | |||||||
| Adjustment for TSI/RBB | — | — | — | (7) | — | (7) | |||||||
| Total | 312 | 297 | 609 | 302 | 294 | 596 | |||||||
|
32 |
| £m | 2000 | 1999 | |||||||||||
|---|---|---|---|---|---|---|---|---|---|---|---|---|---|
| Divisional profit margin | H1 | H2 | FY | H1 | H2 | FY | |||||||
| Reuters Information | 17% | 15% | 16% | 14% | 17% | 16% | |||||||
| Reuters Trading Solutions | 27% | 30% | 29% | 31% | 28% | 29% | |||||||
| Reuters Financial | 20% | 20% | 20% | 19% | 21% | 20% | |||||||
| Reuterspace | (23%) | (32%) | (29%) | (7%) | (12%) | (10%) | |||||||
| Instinet | 22% | 17% | 20% | 31% | 18% | 25% | |||||||
| TSI/RBB | — | — | — | (13%) | n/a | (13%) | |||||||
| Total divisional profit margin | 18% | 16% | 17% | 19% | 19% | 19% | |||||||
| Total divisional profit margin excluding | |||||||||||||
| TSI/RBB | 18% | 16% | 17% | 20% | 19% | 19% | |||||||
| Business transformation costs | (41) | (98) | (139) | — | — | — | |||||||
| Goodwill amortisation | (27) | (32) | (59) | (24) | (23) | (47) | |||||||
| Operating profit | 244 | 167 | 411 | 278 | 271 | 549 | |||||||
| Operating result from joint ventures | (3) | (14) | (17) | — | (6) | (6) | |||||||
| Operating result from associates | — | (16) | (16) | (1) | (10) | (11) | |||||||
| Profit on disposal of fixed assets/investments | 202 | 89 | 291 | 29 | 21 | 50 | |||||||
| Profit on disposal of subsidiary undertakings | 8 | 2 | 10 | — | 52 | 52 | |||||||
| Amounts written off fixed asset investments | — | (30) | (30) | — | — | — | |||||||
| Income from fixed asset investments | 1 | 4 | 5 | — | 2 | 2 | |||||||
| Net interest | (2) | 5 | 3 | (6) | 2 | (4) | |||||||
| Profit before taxation | 450 | 207 | 657 | 300 | 332 | 632 | |||||||
| Taxation on profit on ordinary activities | (97) | (28) | (125) | (98) | (109) | (207) | |||||||
| Profit after taxation attributable to ordinary | |||||||||||||
| shareholders | 353 | 179 | 532 | 202 | 223 | 425 | |||||||
| Tax rate on profit before goodwill | 20% | 17% | 30% | 30% | |||||||||
| Basic earnings per ordinary share | 25.2p | 37.9p | 14.3p | 30.2p | |||||||||
| Earnings per ADS (US$ rate used = $1.49) | $ 2.25 | $ 3.39 | $ 1.28 | $ 2.70 | |||||||||
| Dividend per ordinary share | 3.65p | 12.35p | 16.00p | 3.65p | 11.00p | 14.65p | |||||||
| Number of ordinary shares ranking for dividend | |||||||||||||
| (millions) | 1,404 | 1,405 | 1,413 | 1,402 | |||||||||
|
33 |
| £m Net Assets |
2000 | 1999 | |||
|---|---|---|---|---|---|
| Reuters Information | 157 | 276 | |||
| Reuters Trading Solutions | 178 | 154 | |||
| Reuters Financial | 335 | 430 | |||
| Reuterspace | 315 | 110 | |||
| Instinet | 234 | 214 | |||
| Central | 218 | (153) | |||
| 1,102 | 601 | ||||
| User Accesses at period end (000s) | |||||
| Information product accesses | |||||
| High Tier | 215 | 210 | |||
| Middle Tier | 134 | 142 | |||
| Lower Tier | 62 | 42 | |||
| Mobile | 56 | 41 | |||
| Other | 40 | 42 | |||
| Information product total | 507 | 477 | |||
| Dealing accesses | 21 | 23 | |||
| Instinet accesses | 30 | 21 | |||
| Total accesses | 558 | 521 | |||
| Revenue per access (£000) | |||||
| Information products | |||||
| Total High Tier | 6.1 | 6.0 | |||
| Total Reuters Information | 3.9 | 3.6 | |||
| Dealing | 18.4 | 17.6 | |||
| Instinet | 31.4 | 27.8 | |||
| Instinet NYSE market share % | 3.0% | 2.4% | |||
| Instinet Nasdaq market share % | 13.7% | 13.3% | |||
| Total subscriber locations at period end (000s) | 50.6 | 52.8 | |||
| Market value of listed Greenhouse Fund investments at period | |||||
| end (£m) | 99 | 438 | |||
| Market value of TSI holding at period end (£m) | 3,166 | 3,150 | |||
|
34 |
For further information please contact:LondonGeoff Wicks or Peter Thomas New YorkNancy Bobrowitz http://www.about.reuters.com |